
Stock Algorithm Based on Genetic Algorithms: Returns up to 8.04% in 7 Days
Stock Algorithm
The Computer Industry Stocks Package is designed for investors and analysts who need stock algorithm predictions of the best-performing stocks for the whole Computer Industry. It includes 20 stocks with bullish and bearish signals and indicates the best stocks to buy in the computer industry:
- Top 10 Computer Industry stocks for the long position
- Top 10 Computer Industry stocks for the short position

Package Name: Computer Industry
Recommended Positions: Long
Forecast Length: 7 Days (6/14/2020 – 6/22/2020)
I Know First Average: 4.63%
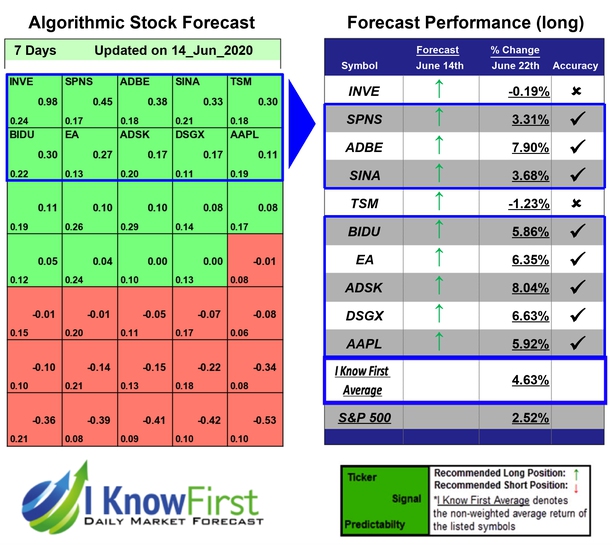
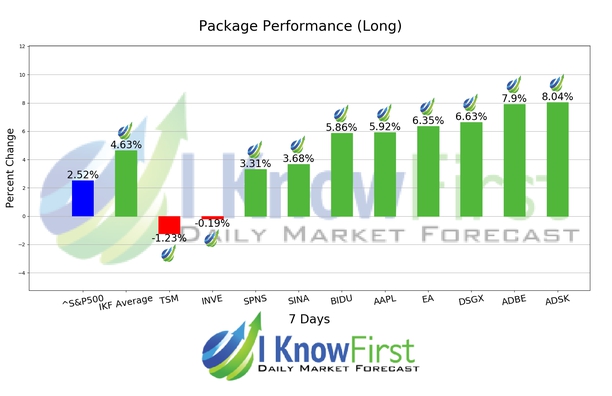
During the 7 Days forecasted period several picks in the Computer Industry Package saw significant returns. The algorithm had correctly predicted 8 out 10 returns. ADSK was our best stock pick this week a return of 8.04%. Further notable returns came from ADBE and DSGX at 7.9% and 6.63%, respectively. The package had an overall average return of 4.63%, providing investors with a 2.11% premium over the S&P 500’s return of 2.52% during the period.
Autodesk, Inc. operates as a design software and services company worldwide. It operates through Architecture, Engineering, and Construction; Manufacturing; Platform Solutions and Emerging Business; and Media and Entertainment segments. Autodesk, Inc. was founded in 1982 and is headquartered in San Rafael, California.
Algorithmic traders utilize these daily forecasts by the I Know First market prediction system as a tool to enhance portfolio performance, verify their own analysis and act on market opportunities faster. This forecast was sent to current I Know First subscribers.
How to interpret this diagram
Algorithmic Stock Forecast: The table on the left is a stock forecast produced by I Know First’s algorithm. Each day, subscribers receive forecasts for six different time horizons. Note that the top 10 stocks in the 1-month forecast may be different than those in the 1-year forecast. In the included table, only the relevant stocks have been included. The boxes are arranged according to their respective signal and predictability values (see below for detailed definitions). A green box represents a positive forecast, suggesting a long position, while a red represents a negative forecast, suggesting a short position.
Please note-for trading decisions use the most recent forecast. Get today’s forecast and Top stock picks.


