
Small Cap Stocks To Buy Based on Genetic Algorithms: Returns up to 244.47% in 1 Year
Small Cap Stocks To Buy
The Small Cap Stocks Package includes recommendations by the I Know First algorithm for small cap stocks to buy with a market capitalization of less than $1 billion:
- Top 10 Small Cap stocks to buy for the long position
- Top 10 Small Cap stocks to buy for the short position

Package Name: Small Cap Forecast
Recommended Positions: Long
Forecast Length: 1 Year (11/24/20 – 11/24/21)
I Know First Average: 68.58%
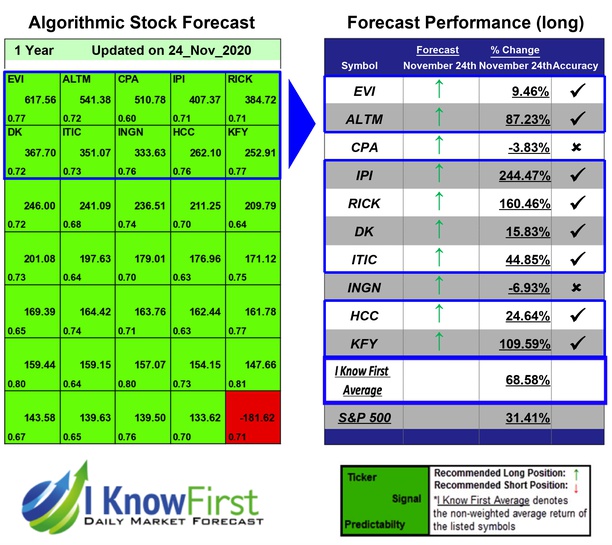
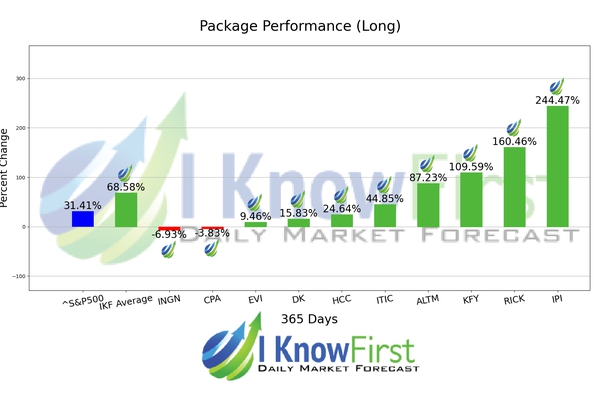
During the 1 Year forecasted period several picks in the Small Cap Forecast Package saw significant returns. The algorithm had correctly predicted 8 out of 10 returns. IPI was the top performing prediction with a return of 244.47%. The suggested trades for RICK and KFY also had notable 1 Year yields of 160.46% and 109.59%, respectively. The package had an overall average return of 68.58%, providing investors with a 37.17% premium over the S&P 500’s return of 31.41% during the period.
Intrepid Potash, Inc (IPI). engages in the extraction, production, and sale of potassium containing products in the United States. It produces muriate of potash and langbeinite, a low-chloride potassium fertilizer that contains sulfate and magnesium. The company also offers salt, magnesium chloride, and metal recovery salts. It serves agricultural, industrial, and animal feed markets. The company was incorporated in 2007 and is based in Denver, Colorado.
Algorithmic traders utilize these daily forecasts by the I Know First market prediction system as a tool to enhance portfolio performance, verify their own analysis and act on market opportunities faster. This forecast was sent to current I Know First subscribers.
How to interpret this diagram
Algorithmic Stock Forecast: The table on the left is a stock forecast produced by I Know First’s algorithm. Each day, subscribers receive forecasts for six different time horizons. Note that the top 10 stocks in the 1-month forecast may be different than those in the 1-year forecast. In the included table, only the relevant stocks have been included. The boxes are arranged according to their respective signal and predictability values (see below for detailed definitions). A green box represents a positive forecast, suggesting a long position, while a red represents a negative forecast, suggesting a short position.
Please note-for trading decisions use the most recent forecast. Get today’s forecast and Top stock picks.


