
Small Cap Stocks To Buy Based on Genetic Algorithms: Returns up to 125.0% in 3 Months
Small Cap Stocks To Buy
The Small Cap Stocks Package includes recommendations by the I Know First algorithm for small cap stocks to buy with a market capitalization of less than $1 billion:
- Top 10 Small Cap stocks to buy for the long position
- Top 10 Small Cap stocks to buy for the short position

Package Name: Small Cap Forecast
Recommended Positions: Long
Forecast Length: 3 Months (12/17/20 – 3/17/21)
I Know First Average: 30.08%
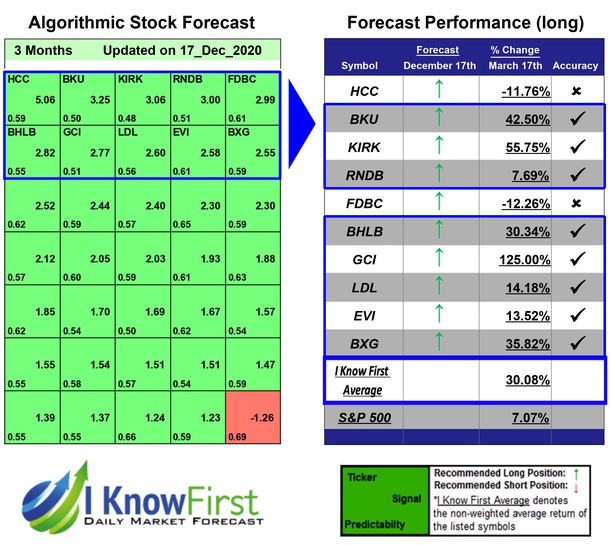
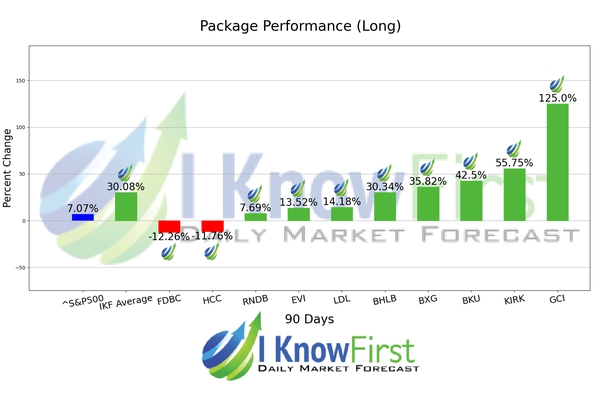
The algorithm correctly predicted 8 out 10 of the suggested trades in the Small Cap Forecast Package for this 3 Months forecast. The top performing prediction from this package was GCI with a return of 125.0%. KIRK and BKU also performed well for this time horizon with returns of 55.75% and 42.5%, respectively. The package saw an overall yield of 30.08% versus the S&P 500’s return of 7.07% implying a market premium of 23.01%.
Gannett Co., Inc. operates as a multi-platform news and information company. The company’s operations comprise USA TODAY, a newspaper in print and digital circulation; 92 daily local publications in the United States and Guam; approximately 400 non-daily publications in the United States; and approximately 150 local news brands online, mobile, and in print in the United Kingdom. It also provides commercial printing, marketing, and data services. The company was formerly known as Gannett SpinCo, Inc. and changed its name to Gannett Co., Inc. in May 2015. Gannett Co., Inc. was incorporated in 2014 and is based in McLean, Virginia.
Algorithmic traders utilize these daily forecasts by the I Know First market prediction system as a tool to enhance portfolio performance, verify their own analysis and act on market opportunities faster. This forecast was sent to current I Know First subscribers.
How to interpret this diagram
Algorithmic Stock Forecast: The table on the left is a stock forecast produced by I Know First’s algorithm. Each day, subscribers receive forecasts for six different time horizons. Note that the top 10 stocks in the 1-month forecast may be different than those in the 1-year forecast. In the included table, only the relevant stocks have been included. The boxes are arranged according to their respective signal and predictability values (see below for detailed definitions). A green box represents a positive forecast, suggesting a long position, while a red represents a negative forecast, suggesting a short position.
Please note-for trading decisions use the most recent forecast. Get today’s forecast and Top stock picks.


