
Small Cap Stocks Based on Pattern Recognition: Returns up to 156.65% in 14 Days
Small Cap Stocks
The Small Cap Package includes recommendations by the I Know First algorithm for small cap stocks to buy with a market capitalization of less than $1 billion:
- Top 10 Small Cap stocks to buy for the long position
- Top 10 Small Cap stocks to buy for the short position

Package Name: Small Cap Forecast
Recommended Positions: Long
Forecast Length: 14 Days (4/16/2020 – 4/30/2020)
I Know First Average: 38.08%
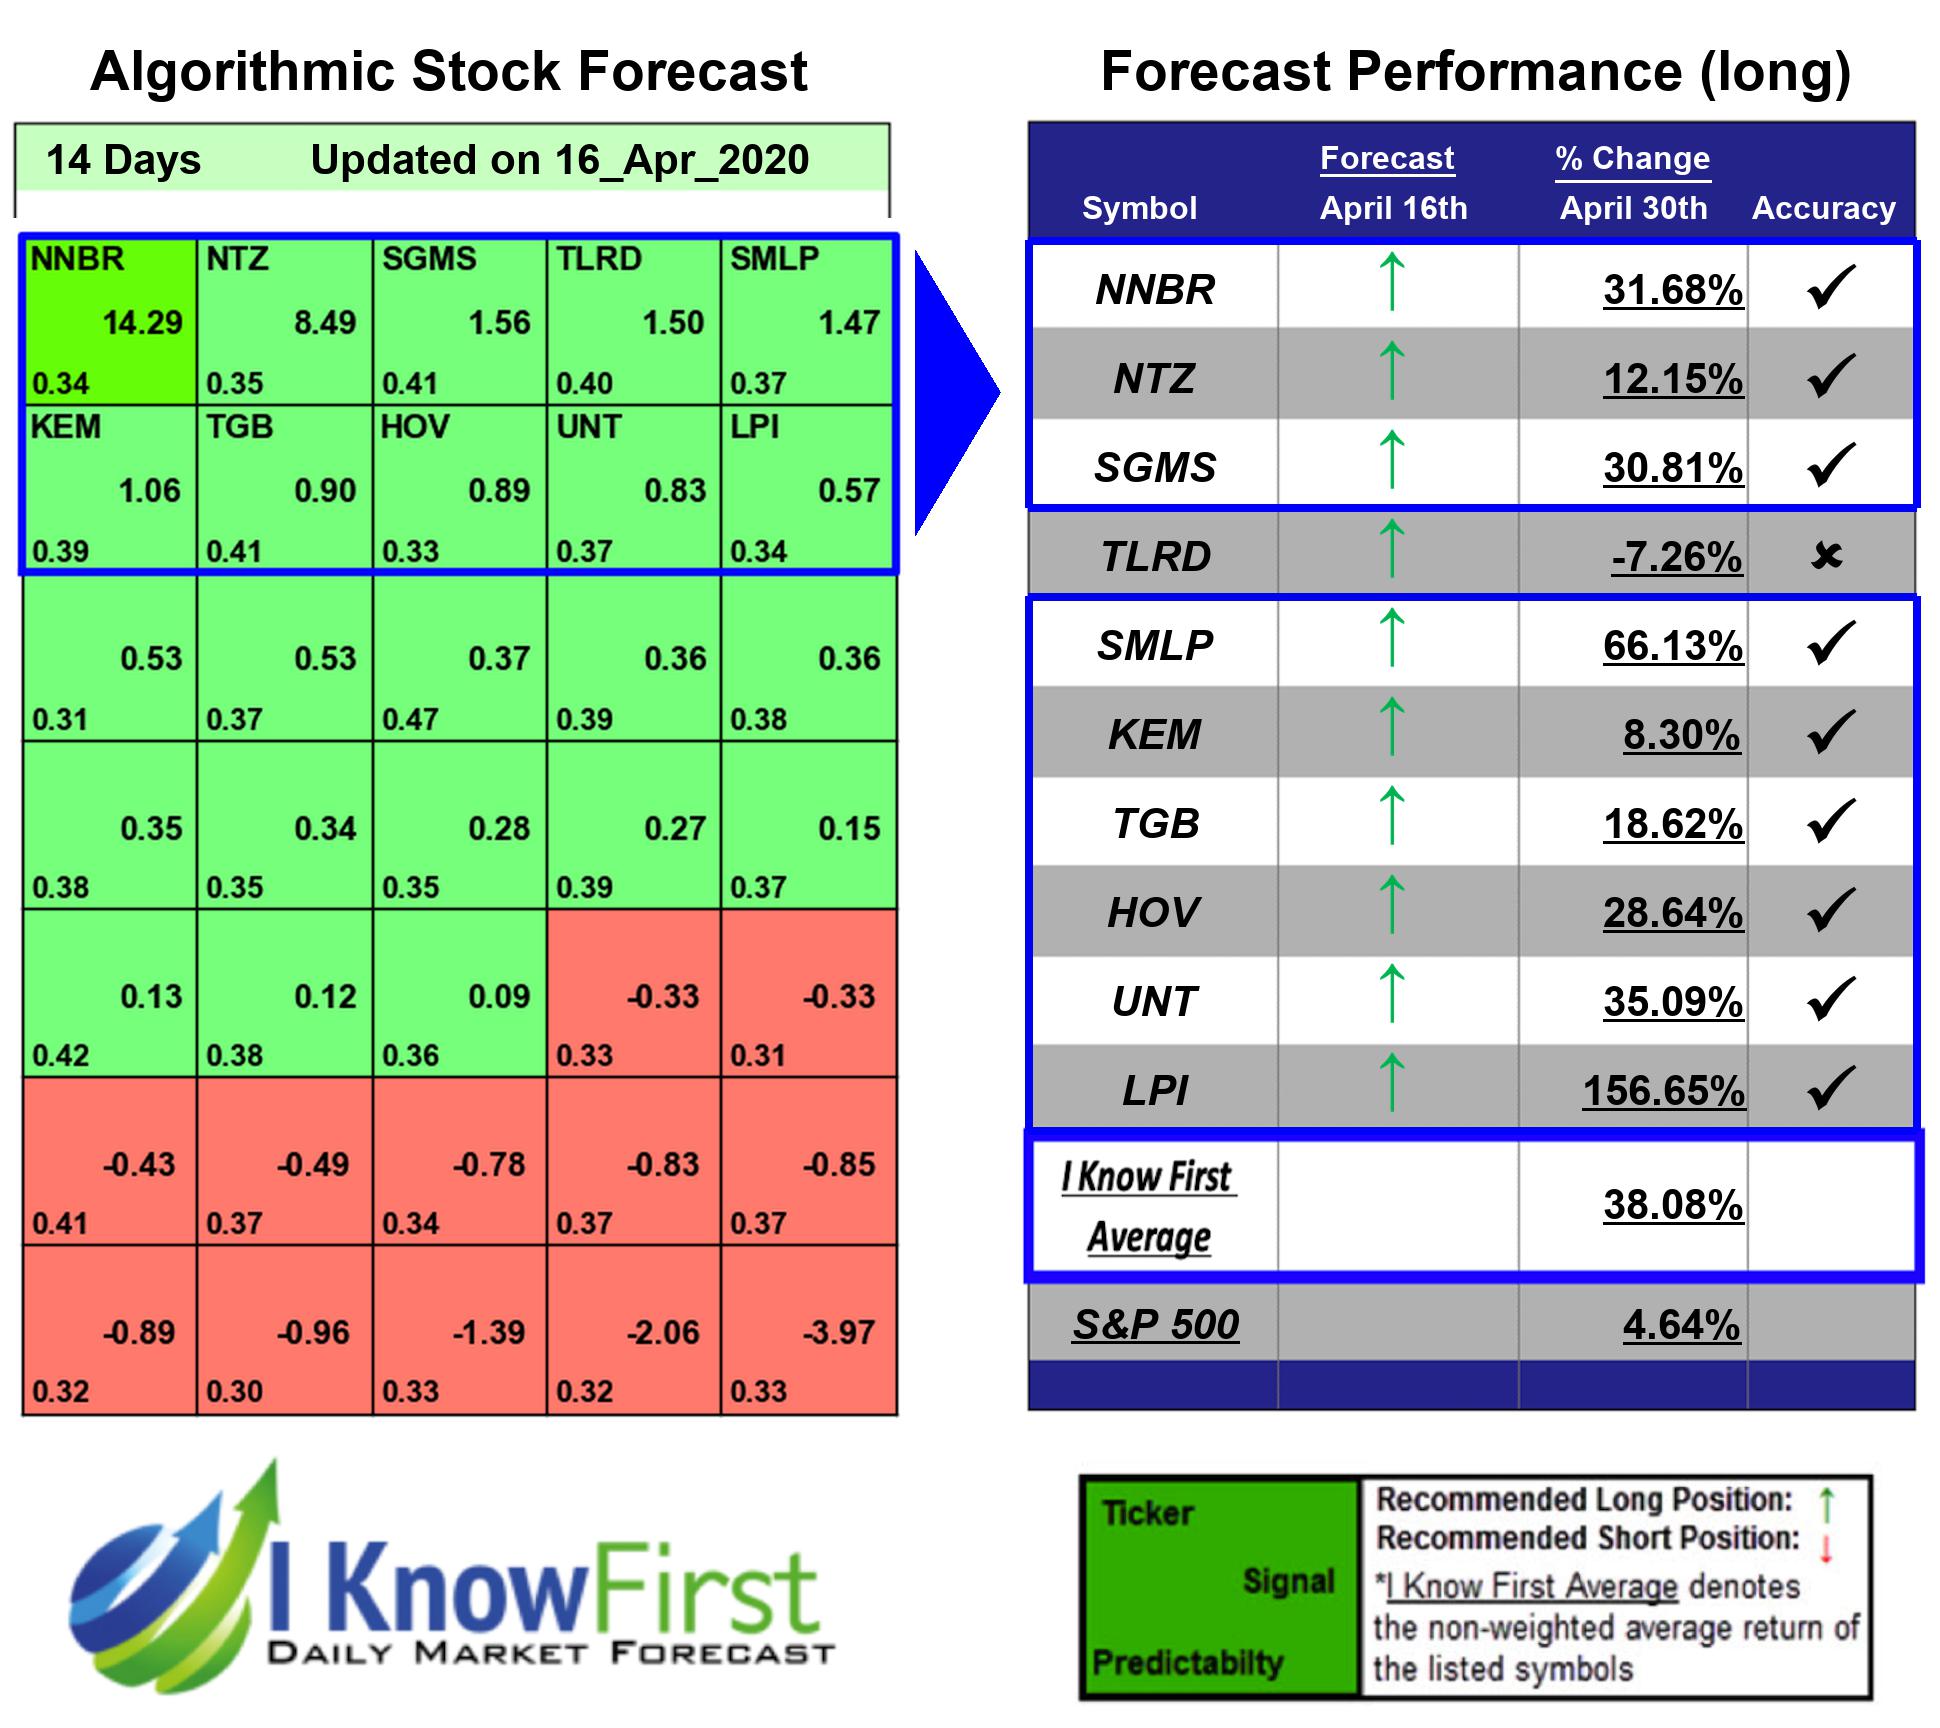

Several predictions in this 14 Days forecast saw significant returns. The algorithm had correctly predicted 9 out 10 stock movements. The prediction with the highest return was LPI, at 156.65%. SMLP, and UNT had notable returns of 66.13% and 35.09%. With these notable trade returns, the package itself registered an average return of 38.08% compared to the S&P 500’s return of 4.64% for the same period.
Laredo Petroleum, Inc. (LPI) operates as an independent energy company in the United States. It focuses on the acquisition, exploration, and development of oil and natural gas properties, as well as the transportation of oil and natural gas primarily in the Permian Basin in West Texas. As of December 31, 2015, it had interests in the 135,408 net acres in the Permian Basin; and had total proved reserves of 125,698 thousand barrels of oil equivalent. The company was formerly known as Laredo Petroleum Holdings, Inc. and changed its name to Laredo Petroleum, Inc. (LPI) in December 2013. Laredo Petroleum, Inc. (LPI) was founded in 2006 and is headquartered in Tulsa, Oklahoma.
Algorithmic traders utilize these daily forecasts by the I Know First market prediction system as a tool to enhance portfolio performance, verify their own analysis and act on market opportunities faster. This forecast was sent to current I Know First subscribers.
How to interpret this diagram
Algorithmic Stock Forecast: The table on the left is a stock forecast produced by I Know First’s algorithm. Each day, subscribers receive forecasts for six different time horizons. Note that the top 10 stocks in the 1-month forecast may be different than those in the 1-year forecast. In the included table, only the relevant stocks have been included. The boxes are arranged according to their respective signal and predictability values (see below for detailed definitions). A green box represents a positive forecast, suggesting a long position, while a red represents a negative forecast, suggesting a short position.
Please note-for trading decisions use the most recent forecast. Get today’s forecast and Top stock picks.


