
Small Cap Stocks Based on Genetic Algorithms: Returns up to 44.7% in 1 Month
Small Cap Stocks
The Small Cap Package includes recommendations by the I Know First algorithm for small cap stocks to buy with a market capitalization of less than $1 billion:
- Top 10 Small Cap stocks to buy for the long position
- Top 10 Small Cap stocks to buy for the short position
Package Name: Small Cap Forecast
Recommended Positions: Long
Forecast Length: 1 Month (4/5/2020 – 5/6/2020)
I Know First Average: 14.89%
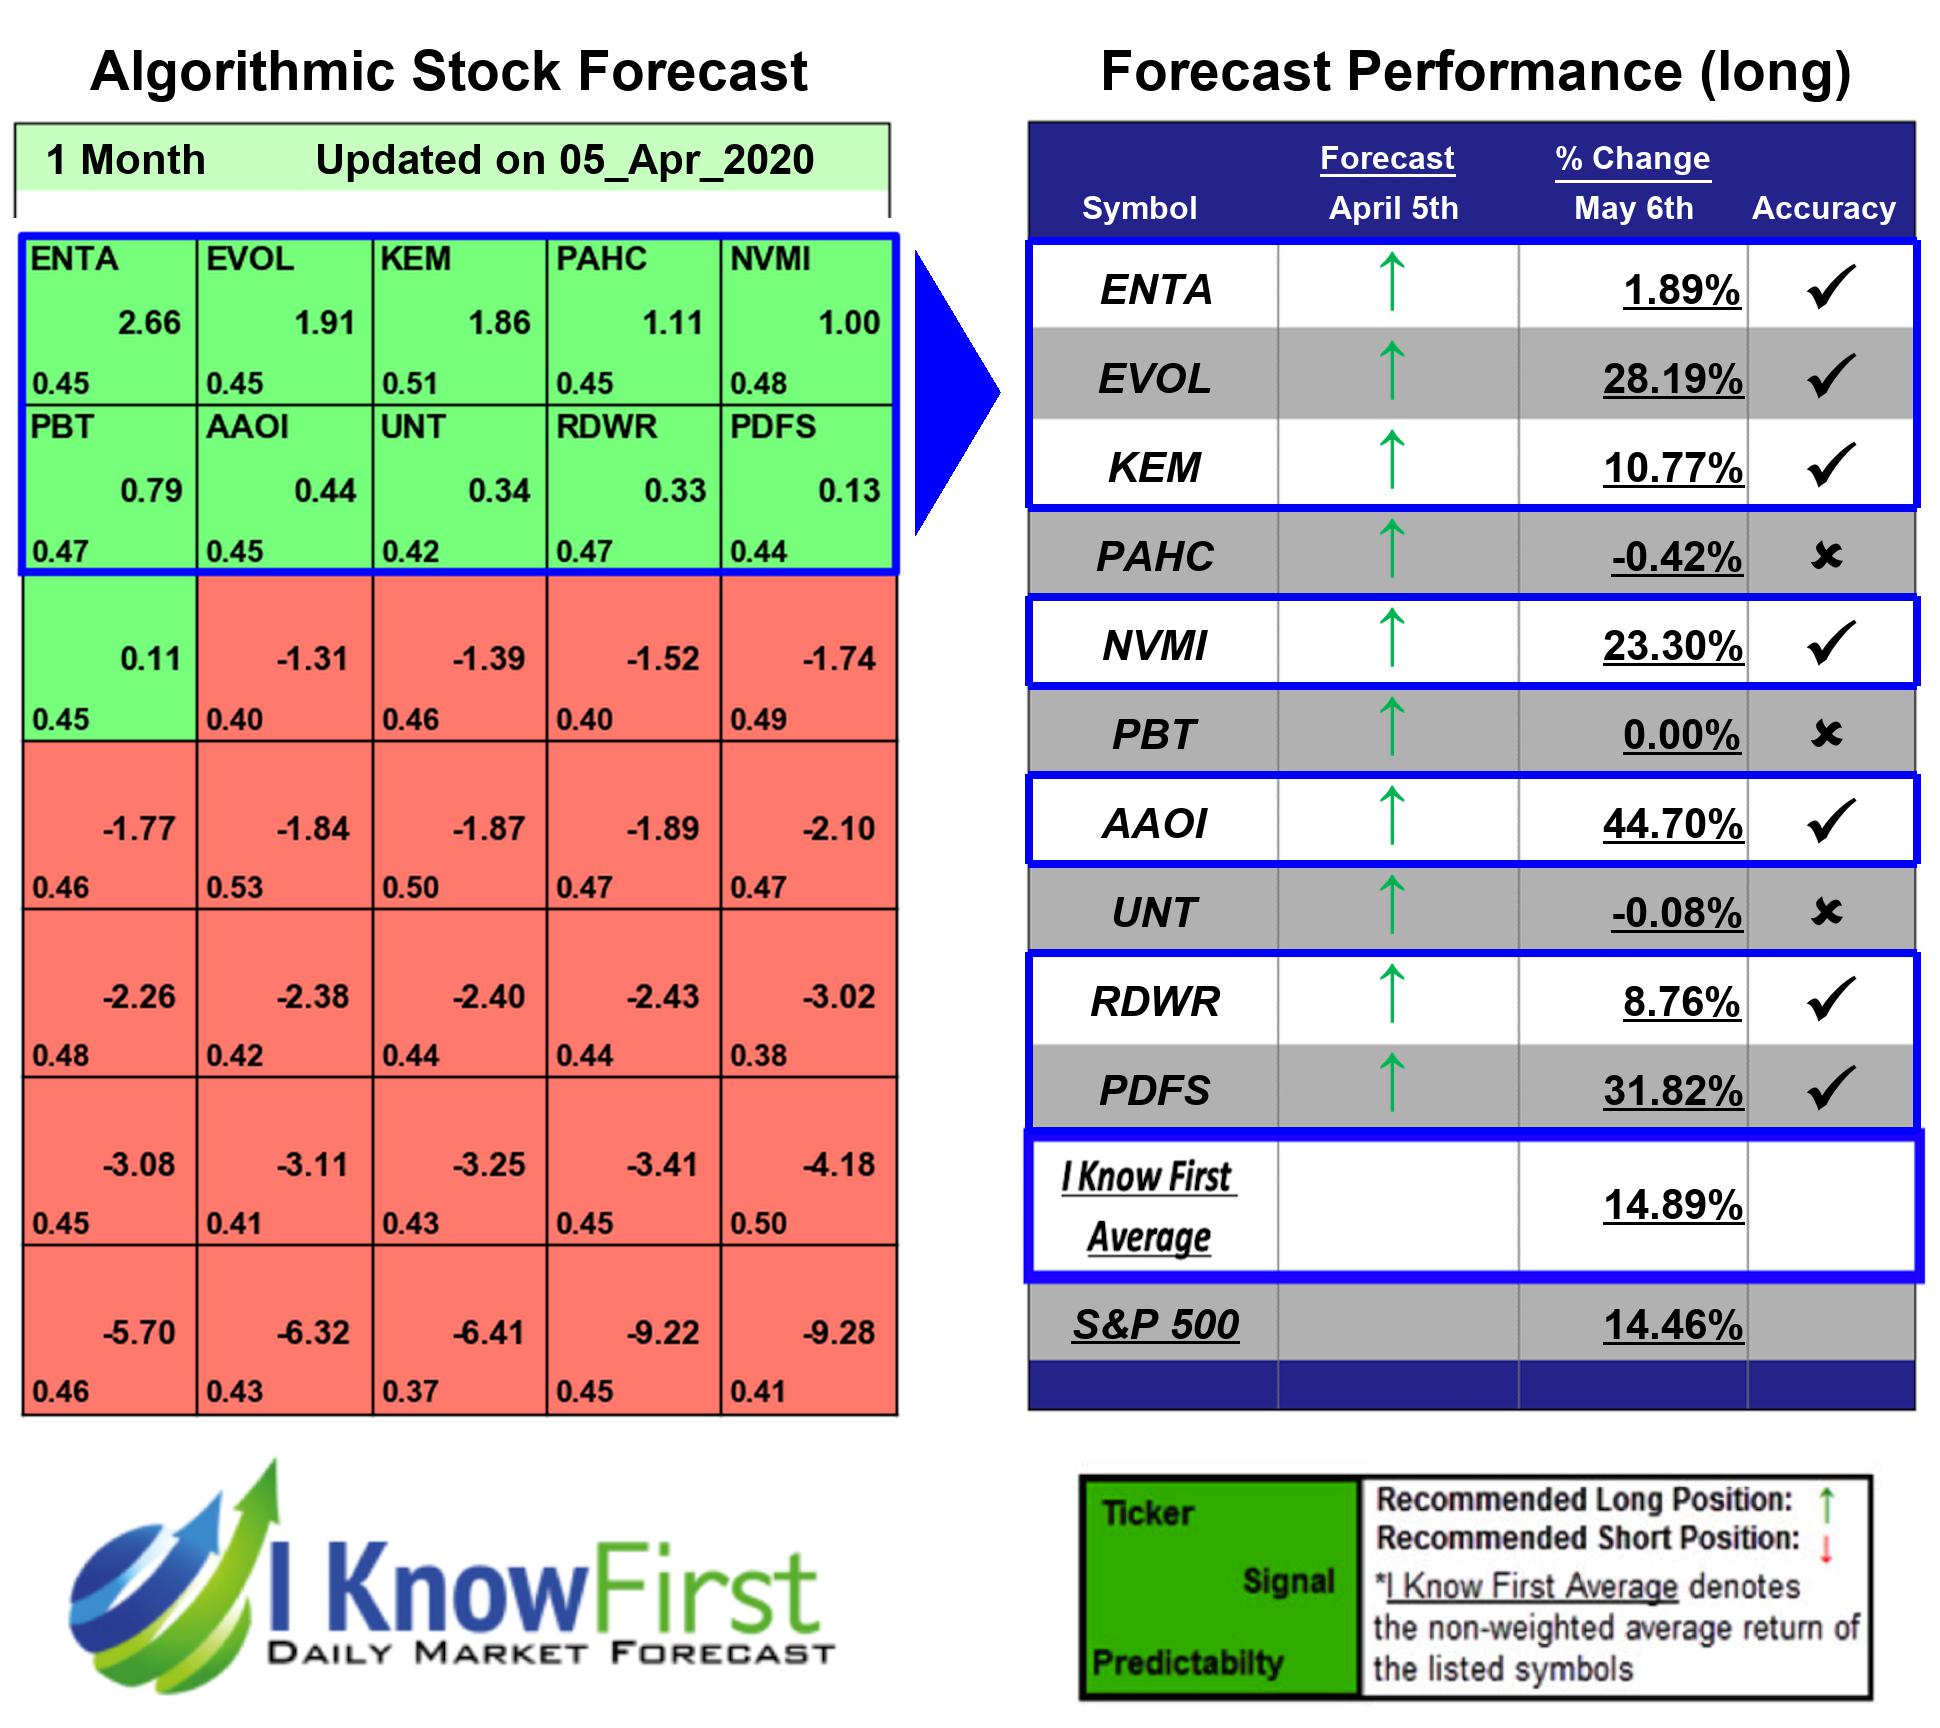
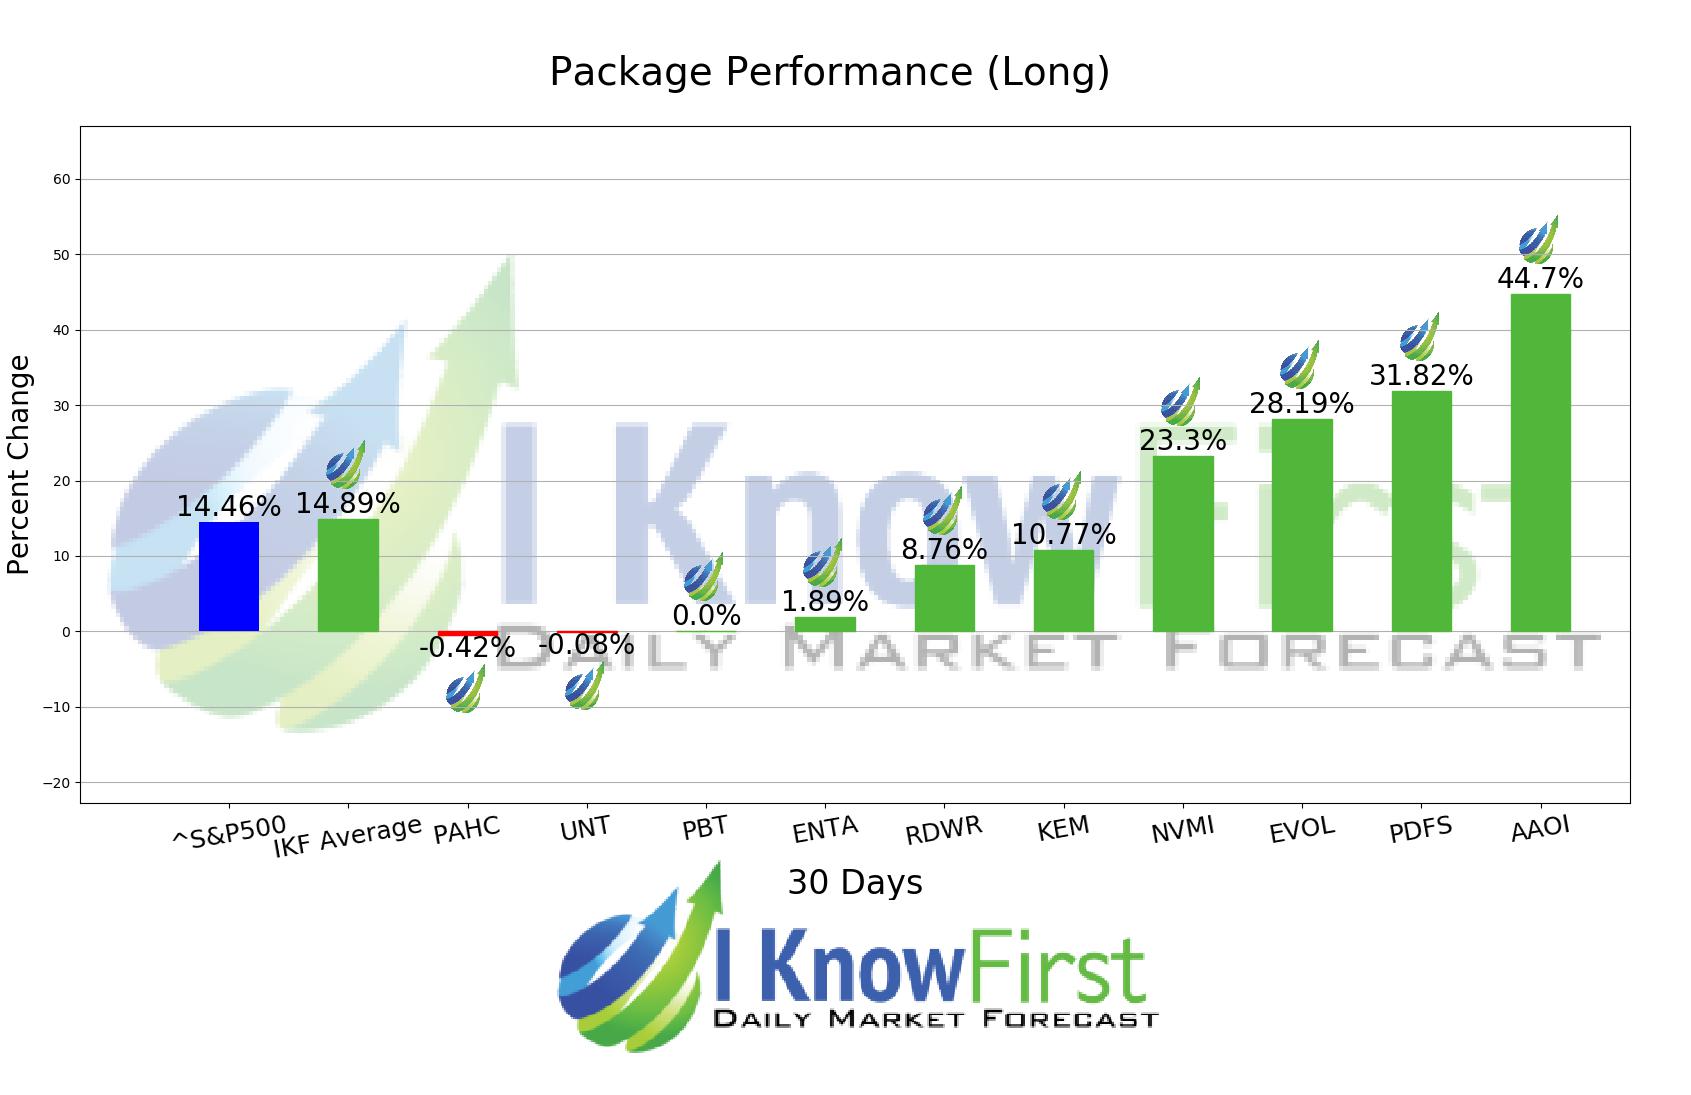
For this 1 Month forecast the algorithm had successfully predicted 7 out of 10 movements. The top-performing prediction in this forecast was AAOI, which registered a return of 44.7%. PDFS and EVOL saw outstanding returns of 31.82% and 28.19%. With these notable trade returns, the package itself registered an average return of 14.89% compared to the S&P 500’s return of 14.46% for the same period.
Applied Optoelectronics, Inc., incorporated on March 25, 2013, is a vertically integrated provider of fiber-optic networking products, primarily for networking end markets, such as Internet data center, cable television (CATV), fiber-to-the-home (FTTH) and telecommunications (telecom). The Company designs and manufactures a range of optical communications products at varying levels of integration, from components, subassemblies and modules to turnkey equipment. To Internet-based (Web 2.0) data center operators, the Company supplies optical transceivers that plug into switches and servers within the data center and allow these network devices to send and receive data over fiber optic cables. The Company supplies a range of products, including lasers, transmitters and transceivers, and turnkey equipment, to the CATV market.
Algorithmic traders utilize these daily forecasts by the I Know First market prediction system as a tool to enhance portfolio performance, verify their own analysis and act on market opportunities faster. This forecast was sent to current I Know First subscribers.
How to interpret this diagram
Algorithmic Stock Forecast: The table on the left is a stock forecast produced by I Know First’s algorithm. Each day, subscribers receive forecasts for six different time horizons. Note that the top 10 stocks in the 1-month forecast may be different than those in the 1-year forecast. In the included table, only the relevant stocks have been included. The boxes are arranged according to their respective signal and predictability values (see below for detailed definitions). A green box represents a positive forecast, suggesting a long position, while a red represents a negative forecast, suggesting a short position.
Please note-for trading decisions use the most recent forecast. Get today’s forecast and Top stock picks.


