Shenzhen Stocks Based on Algo Trading: Returns up to 17.19% in 7 Days
Shenzhen Stocks
This forecast for Shenzhen Stocks is part of the By Country Package, as one of I Know First’s algorithmic trading tools. The full forecast includes daily predictions for a total of 20 stocks with bullish and bearish signals:
- Top 10 Shenzhen stocks for the long position
- Top 10 Shenzhen stocks for the short position
Package Name: Shenzhen Stock Forecast
Recommended Positions: Long
Forecast Length: 7 Days (8/3/21 – 8/10/21)
I Know First Average: 5.68%
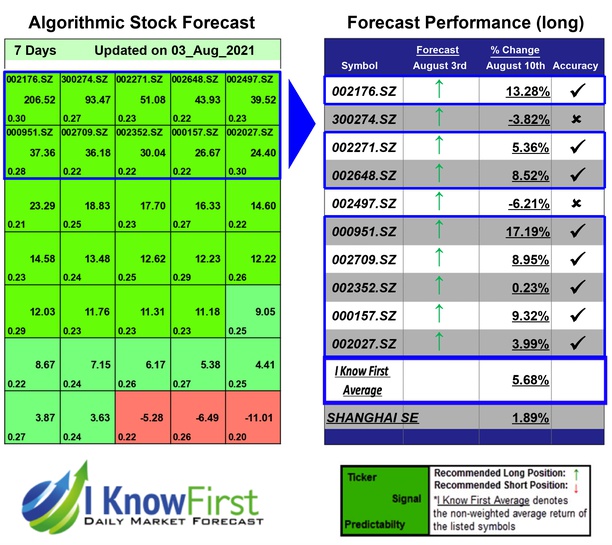
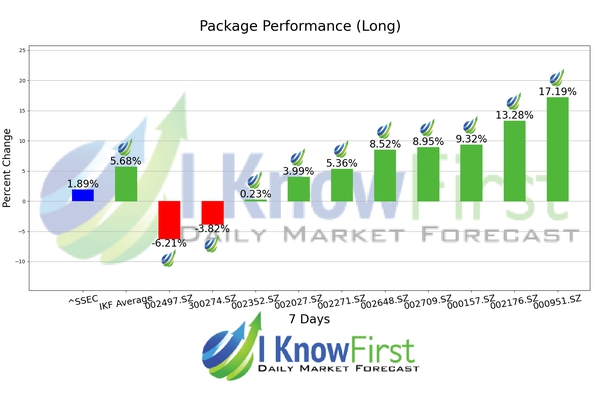
In this 7 Days forecast for the Shenzhen Stock Forecast Package, there were many high performing trades and the algorithm correctly predicted 8 out 10 trades. The greatest return came from 000951.SZ at 17.19%. 002176.SZ and 000157.SZ also performed well for this time horizon with returns of 13.28% and 9.32%, respectively. The package had an overall average return of 5.68%, providing investors with a 3.79% premium over the SHANGHAI SE’s return of 1.89% during the period.
SINOTRUK JINAN TRUCK CO., LTD., formerly CNHTC JINAN TRUCK CO., LTD., is a China-based company principally engaged in the manufacture and distribution of heavy-duty vehicles and spare components. The Company operates its business through sale of finished vehicles and vehicle spare components. Through its subsidiaries, the Company is also engaged in the production of automotive axle boxes and parts, as well as machinery processing business and others. The Company distributes its products within domestic market and to overseas markets.
Algorithmic traders utilize these daily forecasts by the I Know First market prediction system as a tool to enhance portfolio performance, verify their own analysis and act on market opportunities faster. This forecast was sent to current I Know First subscribers.
How to interpret this diagram
Algorithmic Stock Forecast: The table on the left is a stock forecast produced by I Know First’s algorithm. Each day, subscribers receive forecasts for six different time horizons. Note that the top 10 stocks in the 1-month forecast may be different than those in the 1-year forecast. In the included table, only the relevant stocks have been included. The boxes are arranged according to their respective signal and predictability values (see below for detailed definitions). A green box represents a positive forecast, suggesting a long position, while a red represents a negative forecast, suggesting a short position.
Please note-for trading decisions use the most recent forecast. Get today’s forecast and Top stock picks.