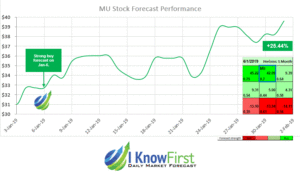
Russell 2000 Index Forecast Based on Algorithms: RUT’s Chart of the Last 5 Months
I Know First, a boutique financial services firms, has successfully
predicted the price of RUT throughout the last year and has a strong track record tracing back even further, by analyzing fundamental variables such as volatility, volume, and short-term trends. The chart shows the algorithm’s predictions for the past 5 months. RUT’s forecast from February 27th 2014 until July 17th 2014. 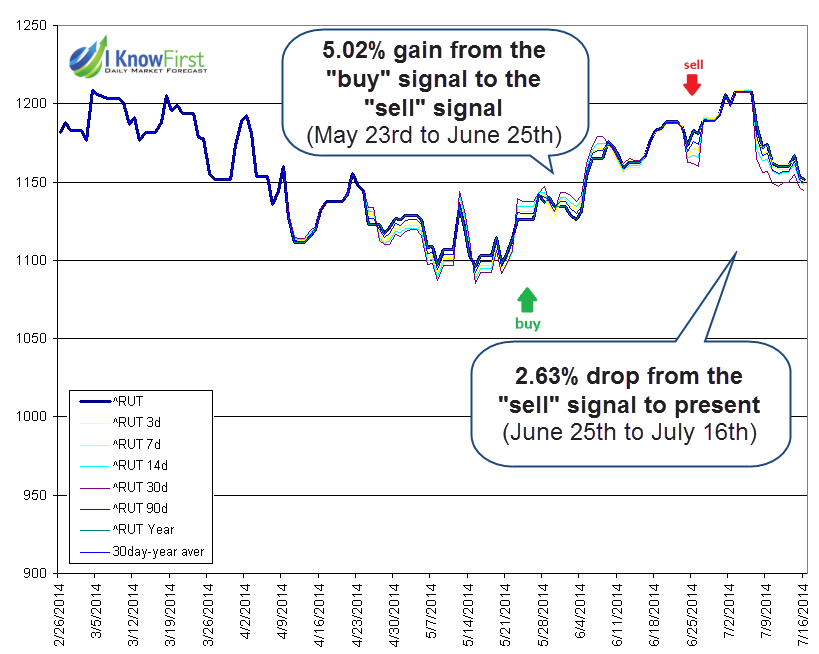 The forecast is based on the short and long term predictions of “I Know First” predictive algorithm. How to read this chart?
Each point on the chart was taken from the actual daily forecast published the morning before the next market opening. The chart shows the actual price in thick blue and the prediction line in dashed red. The projection line is calculated by averaging the signals from the three strongest time frames, 30 days, 90 days and a year ahead forecasts. To further reduce noise, the chart incorporates only the strongest signals that pass the strength filter. Thus, when the signal line is above the actual line, it means “buy,” if below, it means “sell”. The green and red arrows show what would be the best times to enter the market.