
Quantitative Trading Based on Big Data: Returns up to 18.47% in 14 Days
Quantitative Trading
The Computer Industry Stocks Package is designed for investors and analysts who need quantitative trading predictions of the best-performing stocks for the whole Computer Industry. It includes 20 stocks with bullish and bearish signals and indicates the best stocks to buy in the computer industry:
- Top 10 Computer Industry stocks for the long position
- Top 10 Computer Industry stocks for the short position

Package Name: Computer Industry
Recommended Positions: Long
Forecast Length: 14 Days (12/13/20 – 12/27/20)
I Know First Average: 7.15%
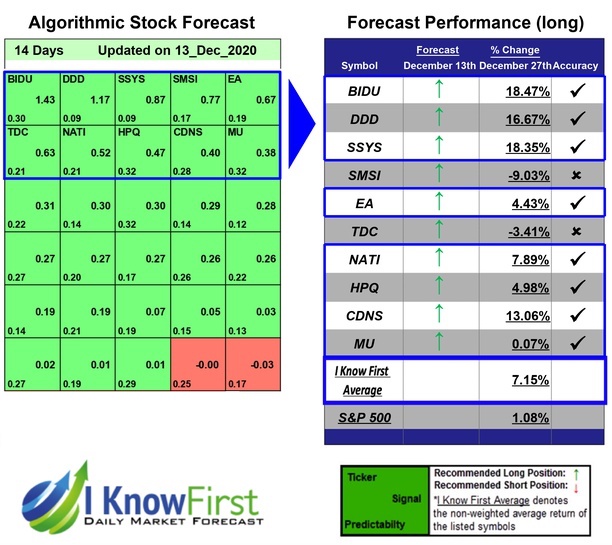
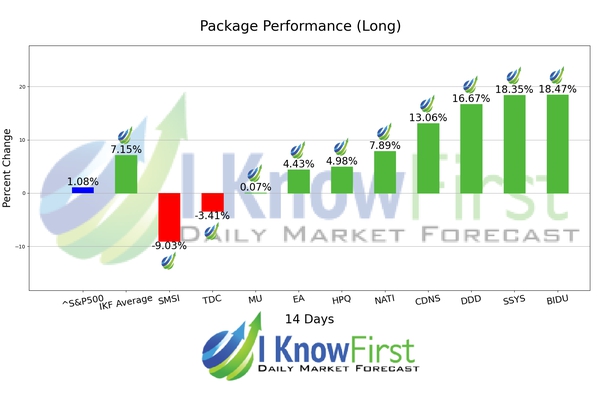
This Computer Industry Package forecast had correctly predicted 8 out of 10 stock movements. BIDU was the highest-earning trade with a return of 18.47% in 14 Days. SSYS, and DDD had notable returns of 18.35% and 16.67%. The package itself saw an overall return of 7.15%, providing investors with a 6.07% premium above the S&P 500’s return of 1.08% for the same time period.
Baidu, Inc. provides Internet search services in China and internationally. It operates through three segments: Search Services, Transaction Services, and IQiyi. It offers Chinese language search platform on its Baidu.com Website that enables users to find relevant information online, including Web pages, news, images, documents, and multimedia files through links provided on its Website; and transaction platform, including Nuomi.com to connect online and offline services provided by third-parties
Algorithmic traders utilize these daily forecasts by the I Know First market prediction system as a tool to enhance portfolio performance, verify their own analysis and act on market opportunities faster. This forecast was sent to current I Know First subscribers.
How to interpret this diagram
Algorithmic Stock Forecast: The table on the left is a stock forecast produced by I Know First’s algorithm. Each day, subscribers receive forecasts for six different time horizons. Note that the top 10 stocks in the 1-month forecast may be different than those in the 1-year forecast. In the included table, only the relevant stocks have been included. The boxes are arranged according to their respective signal and predictability values (see below for detailed definitions). A green box represents a positive forecast, suggesting a long position, while a red represents a negative forecast, suggesting a short position.
Please note-for trading decisions use the most recent forecast. Get today’s forecast and Top stock picks.


