Quant Trading Based on Pattern Recognition: Returns up to 165.55% in 3 Months
Quant Trading
This Retail Stocks forecast is designed for investors and analysts who need quant trading predictions for the best stocks to invest in the retail estate sector (see Retail Stocks Package). It includes 20 stocks with bullish and bearish signals:
- Top 10 Retail stocks for the long position
- Top 10 Retail stocks for the short position
Package Name: Retail Stocks
Recommended Positions: Long
Forecast Length: 3 Months (6/28/2020 – 9/28/2020)
I Know First Average: 38.66%
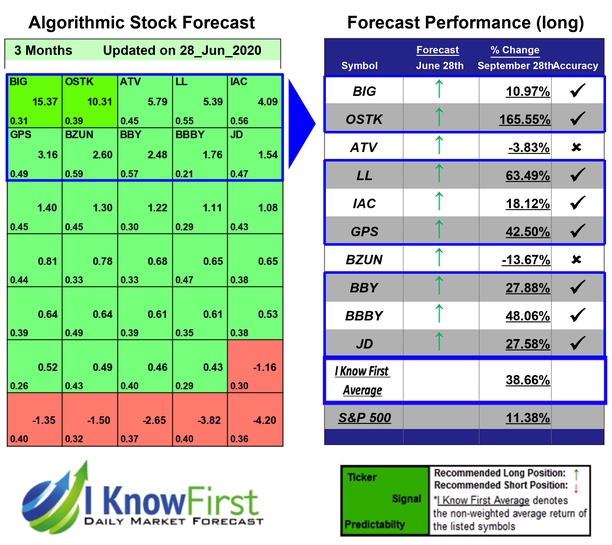
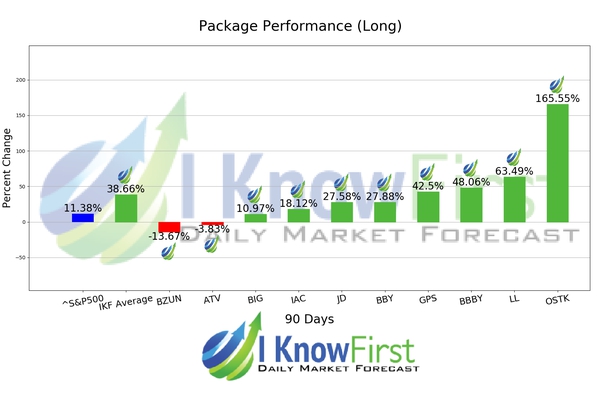
The algorithm correctly predicted 8 out 10 of the suggested trades in the Retail Stocks Package for this 3 Months forecast. The highest trade return came from OSTK, at 165.55%. Additional high returns came from LL and BBBY, at 63.49% and 48.06% respectively. The overall average return in this Retail Stocks package was 38.66%, providing investors with a 27.28% premium over the S&P 500’s return of 11.38% during the same period.
Overstock.com, Inc. operates as an online retailer in the United States. The company operates through two segments, Direct and Partner. It offers brand name, non-brand name, and closeout products, including furniture, home decor, bedding and bath, housewares, jewelry and watches, apparel and designer accessories, health and beauty products, electronics and computers, and sporting goods, among other products; and sells various books, magazines, CDs, DVDs, and video games.
Algorithmic traders utilize these daily forecasts by the I Know First market prediction system as a tool to enhance portfolio performance, verify their own analysis and act on market opportunities faster. This forecast was sent to current I Know First subscribers.
How to interpret this diagram
Algorithmic Stock Forecast: The table on the left is a stock forecast produced by I Know First’s algorithm. Each day, subscribers receive forecasts for six different time horizons. Note that the top 10 stocks in the 1-month forecast may be different than those in the 1-year forecast. In the included table, only the relevant stocks have been included. The boxes are arranged according to their respective signal and predictability values (see below for detailed definitions). A green box represents a positive forecast, suggesting a long position, while a red represents a negative forecast, suggesting a short position.
Please note-for trading decisions use the most recent forecast. Get today’s forecast and Top stock picks.