
Momentum Stocks Based on Big Data: Returns up to 23.4% in 14 Days
Momentum Stocks
The 52 Week High Stocks Package is designed for investors and analysts who need predictions for Momentum stocks currently at their 52-week high price level. It includes 20 stocks with bullish and bearish signals and indicates the best shares to buy and sell:
- 52 Weeks High Top 10 stocks for the long position
- 52 Weeks High Top 10 stocks for the short position
![]()
![]()
Package Name: 52 Week High Stocks
Recommended Positions: Long
Forecast Length: 14 Days (9/30/2020 – 10/14/2020)
I Know First Average: 11.27%

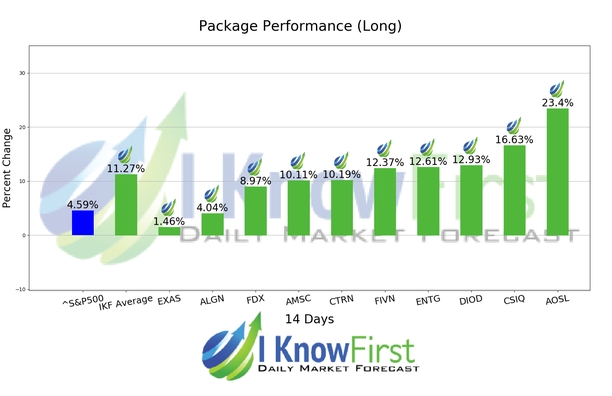
For this 14 Days forecast the algorithm had successfully predicted 10 out of 10 movements. The prediction with the highest return was AOSL, at 23.4%. The suggested trades for CSIQ and DIOD also had notable 14 Days yields of 16.63% and 12.93%, respectively. The package itself saw an overall return of 11.27%, providing investors with a 6.68% premium above the S&P 500’s return of 4.59% for the same time period.
Alpha and Omega Semiconductor Limited, incorporated on September 27, 2000, is a designer, developer and global supplier of power semiconductors. The Company’s portfolio of power semiconductors includes approximately 1,600 products, as of June 30, 2016. The Company’s portfolio of products focuses high-volume applications, including personal computers, flat panel televisions, light-emitting diode (LED) lighting, smart phones, battery packs, consumer and industrial motor controls and power supplies for television, computers, servers and telecommunications equipment. The Company sells its products primarily to distributors in the Asia Pacific region, who in turn sell these products to end customers. The Company conducts its operations primarily in the United States, Hong Kong, China, Taiwan, Korea and Japan.
Algorithmic traders utilize these daily forecasts by the I Know First market prediction system as a tool to enhance portfolio performance, verify their own analysis and act on market opportunities faster. This forecast was sent to current I Know First subscribers.
How to interpret this diagram
Algorithmic Stock Forecast: The table on the left is a stock forecast produced by I Know First’s algorithm. Each day, subscribers receive forecasts for six different time horizons. Note that the top 10 stocks in the 1-month forecast may be different than those in the 1-year forecast. In the included table, only the relevant stocks have been included. The boxes are arranged according to their respective signal and predictability values (see below for detailed definitions). A green box represents a positive forecast, suggesting a long position, while a red represents a negative forecast, suggesting a short position.
Please note-for trading decisions use the most recent forecast. Get today’s forecast and Top stock picks.


