
Momentum Stocks Based on Artificial Intelligence: Returns up to 133.33% in 1 Year
Momentum Stocks
The 52 Week High Stocks Package is designed for investors and analysts who need predictions for stocks currently at their 52-week high price level. It includes 20 momentum stocks with bullish and bearish signals and indicates the best shares to buy and sell:
- 52 Weeks High Top 10 stocks for the long position
- 52 Weeks High Top 10 stocks for the short position
![]()
![]()
Package Name: 52 Week High Stocks
Recommended Positions: Long
Forecast Length: 1 Year (5/14/2019 – 5/14/2020)
I Know First Average: 19.08%
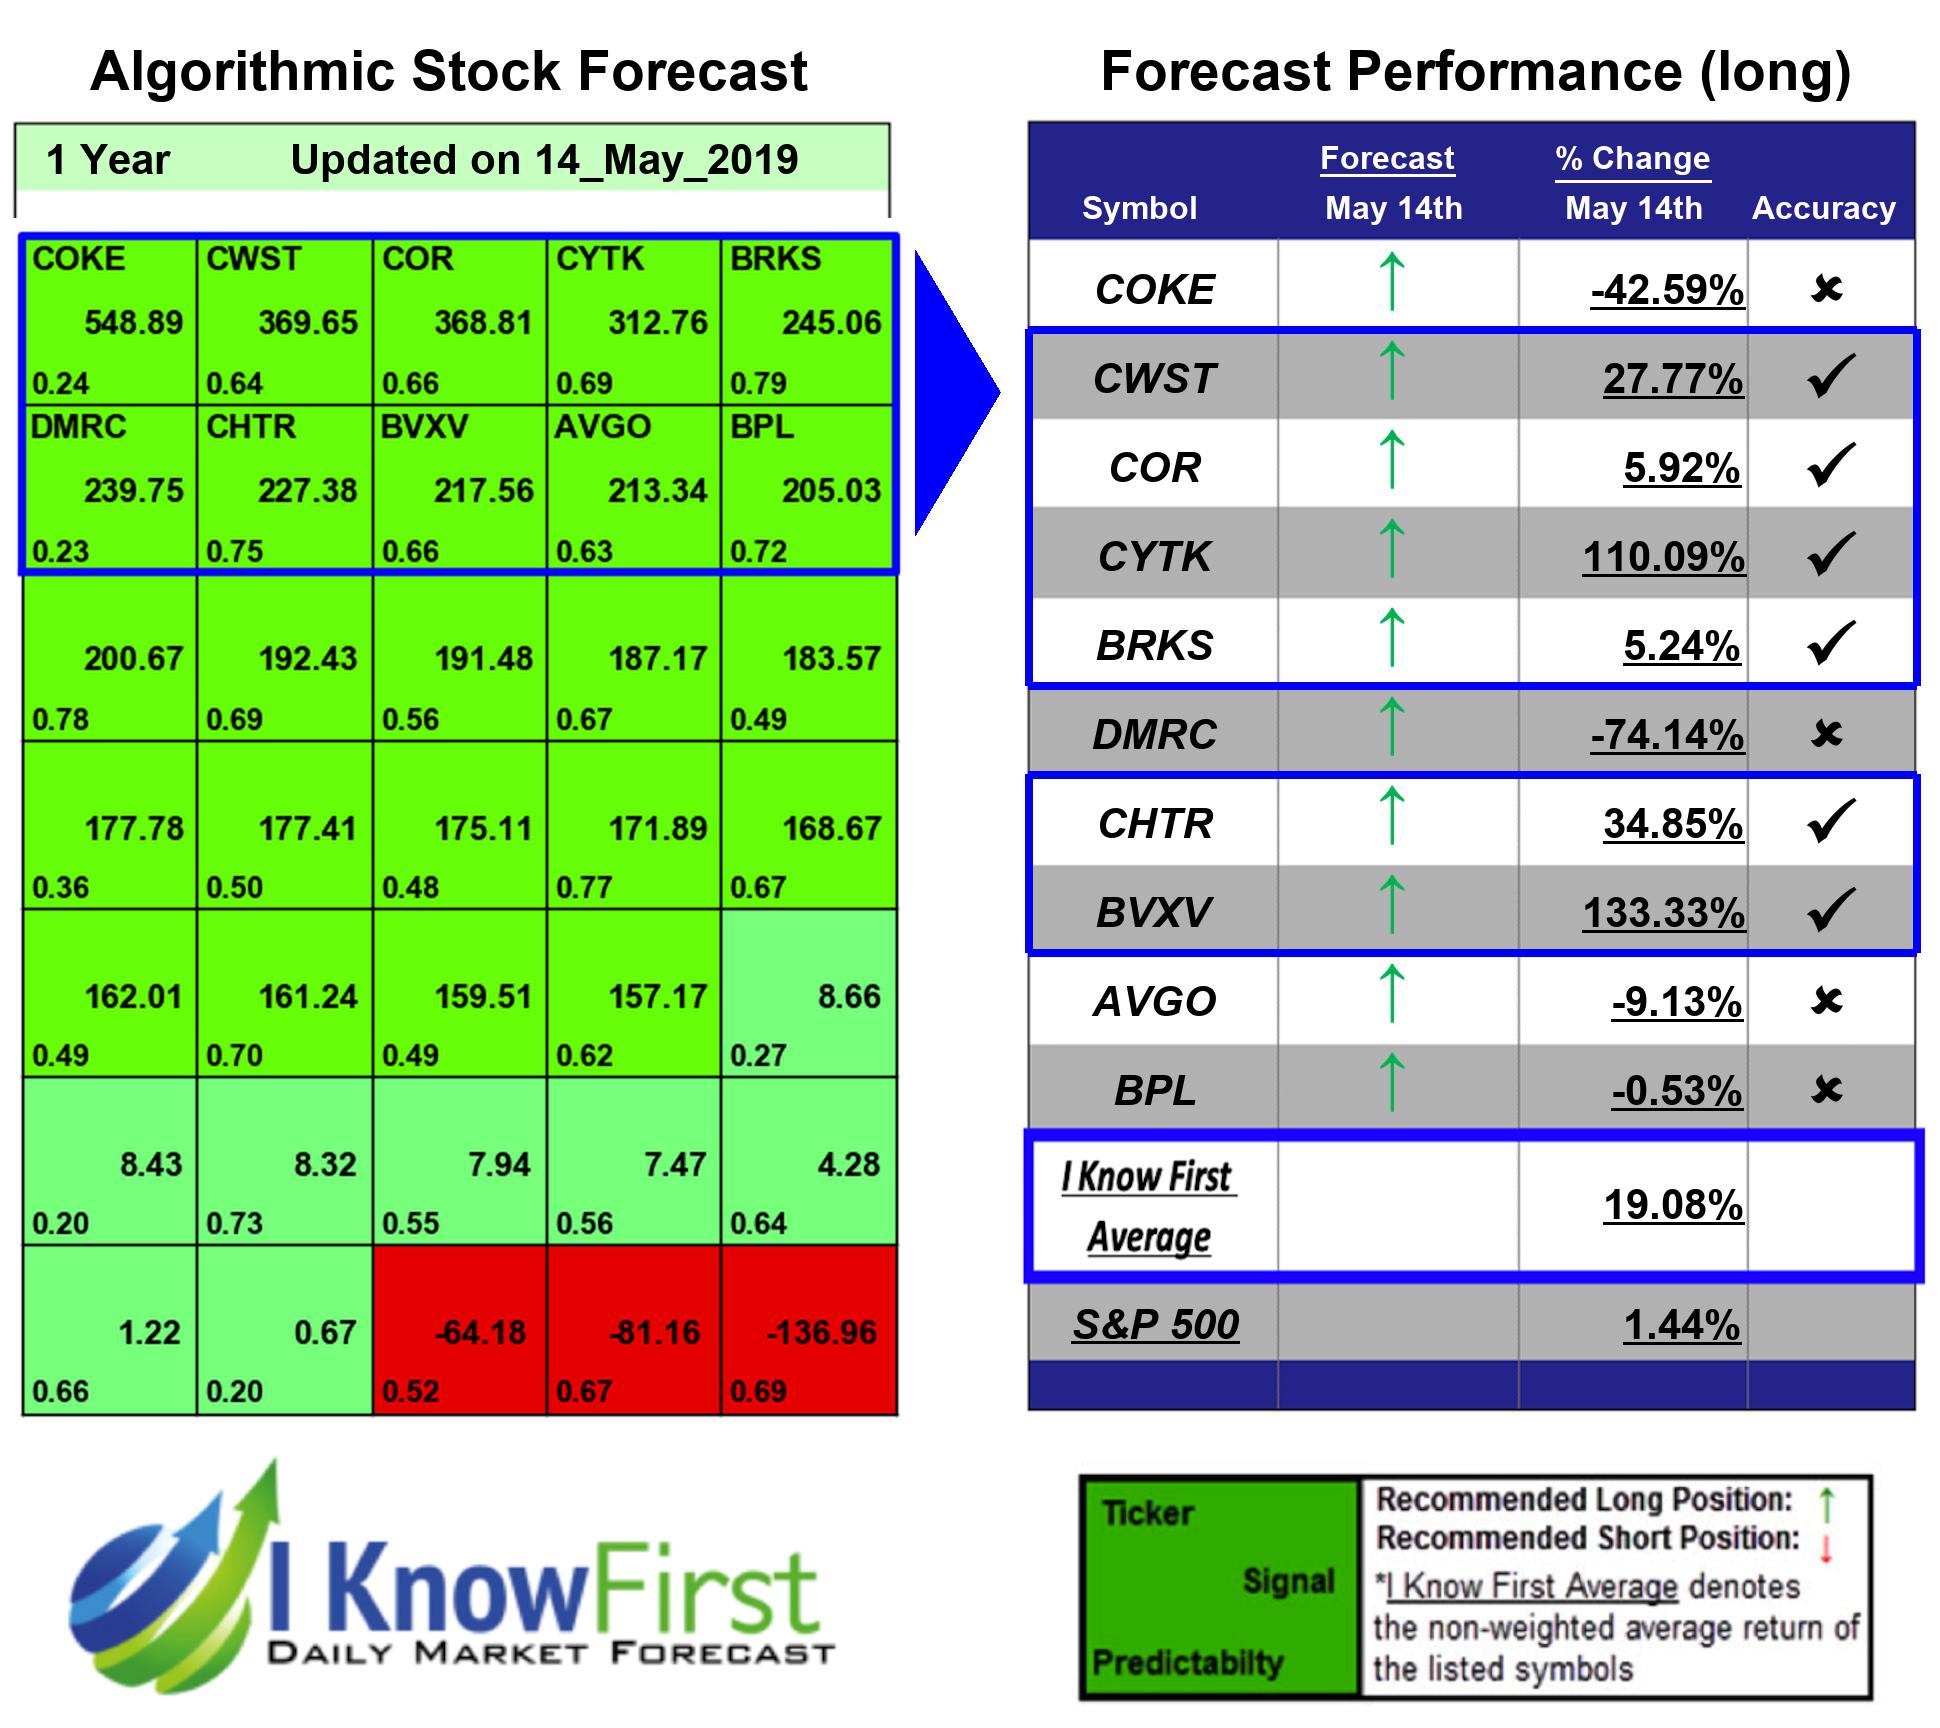
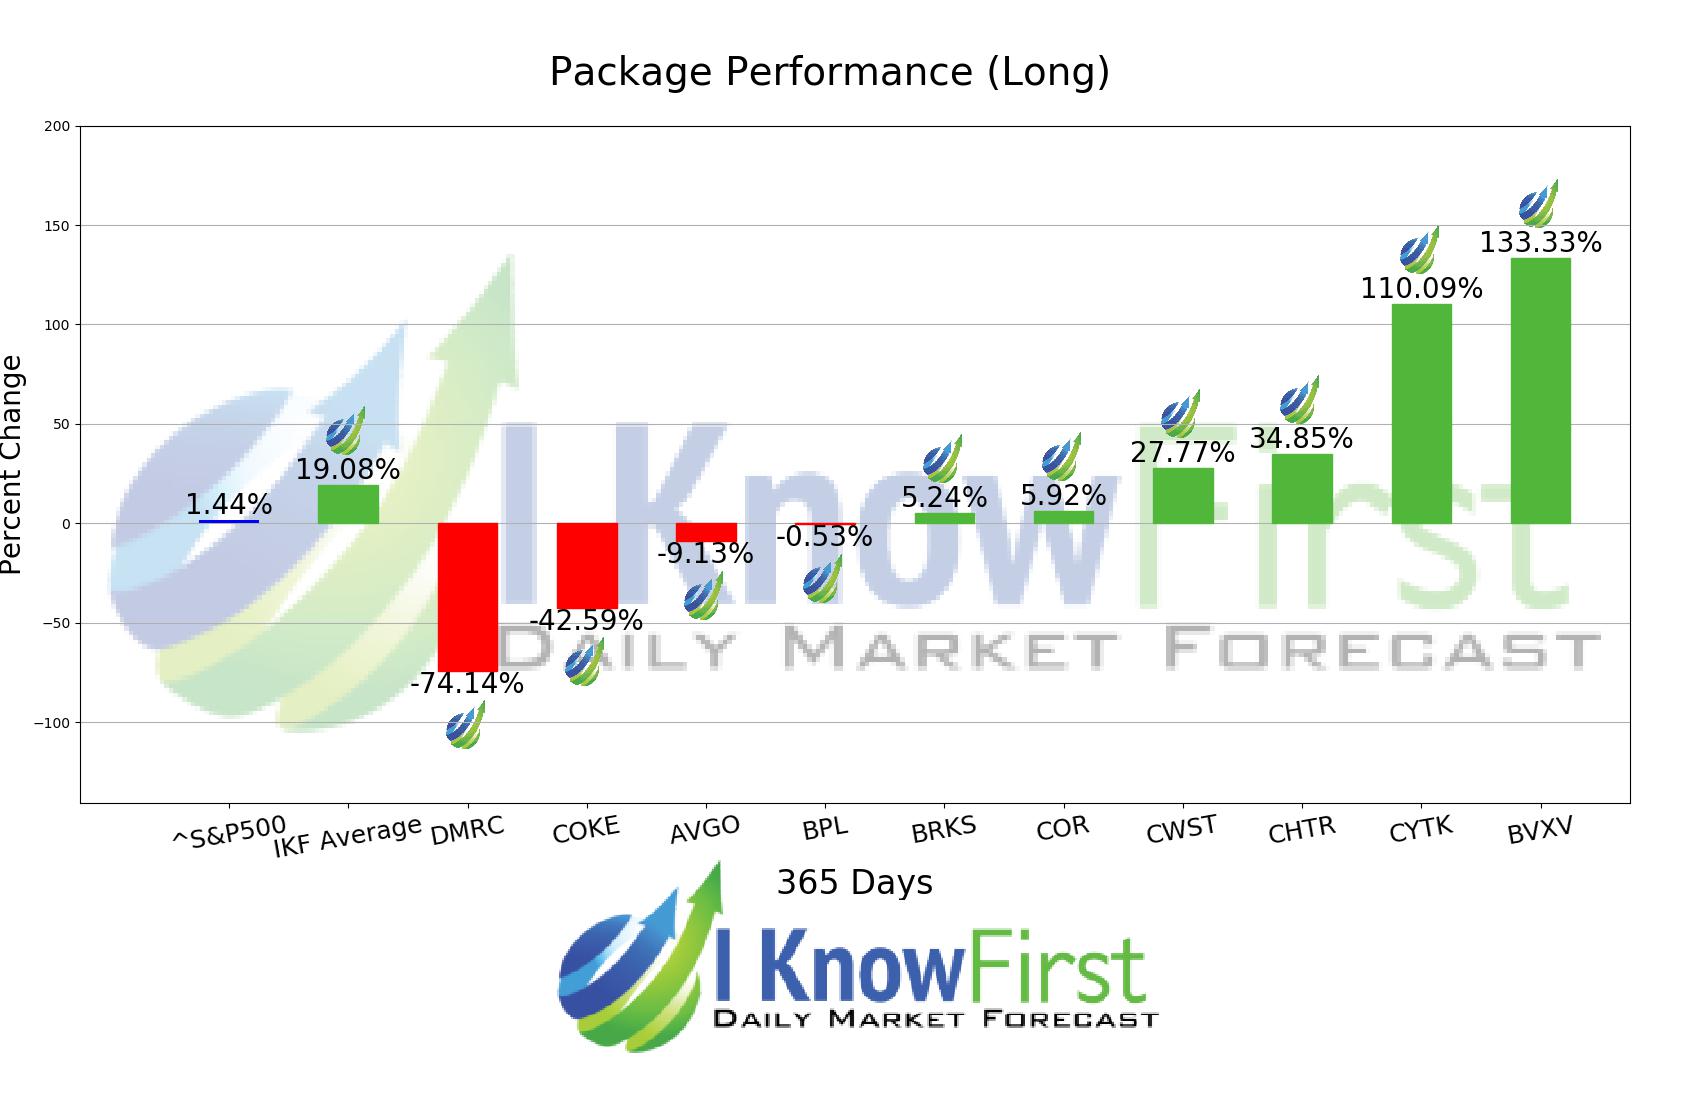
In this 1 Year forecast for the 52 Week High Stocks Package, there were many high performing trades and the algorithm correctly predicted 6 out 10 trades. BVXV was our best stock pick this week a return of 133.33%. CYTK and CHTR also performed well for this time horizon with returns of 110.09% and 34.85%, respectively. The package itself saw an overall return of 19.08%, providing investors with a 17.64% premium above the S&P 500’s return of 1.44% for the same time period.
BiondVax Pharmaceuticals Ltd., a clinical stage biopharmaceutical company, focuses on developing and commercializing immunomodulation therapies for infectious diseases primarily in Israel. Its product candidate is M-001, a synthetic peptide-based protein, which has completed Phase II clinical trials that is used for treating seasonal and pandemic strains of the influenza virus. The company was founded in 2003 and is headquartered in Ness Ziona, Israel.
Algorithmic traders utilize these daily forecasts by the I Know First market prediction system as a tool to enhance portfolio performance, verify their own analysis and act on market opportunities faster. This forecast was sent to current I Know First subscribers.
How to interpret this diagram
Algorithmic Stock Forecast: The table on the left is a stock forecast produced by I Know First’s algorithm. Each day, subscribers receive forecasts for six different time horizons. Note that the top 10 stocks in the 1-month forecast may be different than those in the 1-year forecast. In the included table, only the relevant stocks have been included. The boxes are arranged according to their respective signal and predictability values (see below for detailed definitions). A green box represents a positive forecast, suggesting a long position, while a red represents a negative forecast, suggesting a short position.
Please note-for trading decisions use the most recent forecast. Get today’s forecast and Top stock picks.


