
Mega Cap Stocks Based on Algo Trading: Returns up to 4.41% in 7 Days
Mega Cap Stocks
This stock market forecast includes the best stocks determined by the algorithm with a market capitalization of more than $100 billion.
- Top 10 Mega Cap stocks for the long position
- Top 10 Mega Cap stocks for the short position
Package Name: Mega Cap Forecast
Recommended Positions: Long
Forecast Length: 7 Days (12/8/2020 – 12/15/2020)
I Know First Average: 1.1%
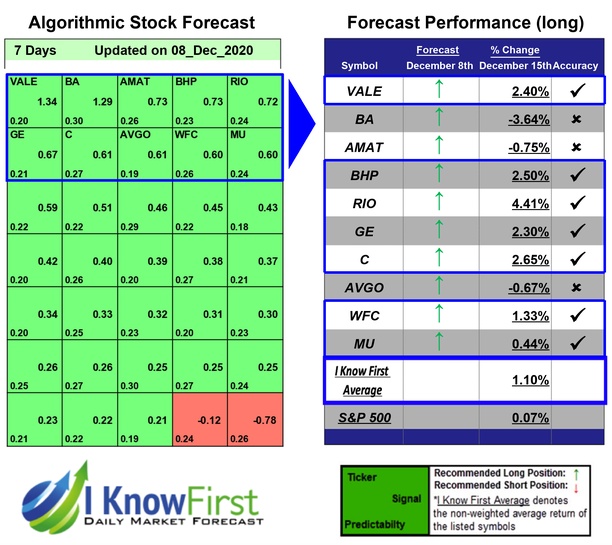

This Mega Cap Forecast Package forecast had correctly predicted 7 out of 10 stock movements. The prediction with the highest return was RIO, at 4.41%. The suggested trades for C and BHP also had notable 7 Days yields of 2.65% and 2.5%, respectively. The package itself saw an overall return of 1.1%, providing investors with a 1.03% premium above the S&P 500’s return of 0.07% for the same time period.
Rio Tinto plc, a mining and metals company, finds, mines, and processes mineral resources. The company mines and produces aluminum products, including bauxite, alumina, and aluminum; copper, gold, silver, and molybdenum, as well as nickel; diamonds, titanium dioxide feedstocks, borates, and salt, as well as high purity iron, metal powders, zircon, and rutile; uranium; iron ore; and thermal coal, and coking or metallurgical coal. It has operations in Australia, North America, Asia, Europe, Africa, and South America. The company was founded in 1873 and is headquartered in London, the United Kingdom. Rio Tinto plc operates as a subsidiary of Rio Tinto Group.
Algorithmic traders utilize these daily forecasts by the I Know First market prediction system as a tool to enhance portfolio performance, verify their own analysis and act on market opportunities faster. This forecast was sent to current I Know First subscribers.
How to interpret this diagram
Algorithmic Stock Forecast: The table on the left is a stock forecast produced by I Know First’s algorithm. Each day, subscribers receive forecasts for six different time horizons. Note that the top 10 stocks in the 1-month forecast may be different than those in the 1-year forecast. In the included table, only the relevant stocks have been included. The boxes are arranged according to their respective signal and predictability values (see below for detailed definitions). A green box represents a positive forecast, suggesting a long position, while a red represents a negative forecast, suggesting a short position.
Please note-for trading decisions use the most recent forecast. Get today’s forecast and Top stock picks.


