
Implied Volatility Options Based on Big Data: Returns up to 69.59% in 1 Month
Implied Volatility Options
The Implied Volatility Options Package is designed for investors and analysts who need implied volatility predictions for options trading. It includes 20 stock options with bullish and bearish signals for implied volatility and indicates the best options to buy and sell:
- Implied volatility Top 10 call options
- Implied volatility Top 10 put options

Package Name: Implied Volatility Options
Recommended Positions: Long
Forecast Length: 1 Month (3/16/22 – 4/16/22)
I Know First Average: 18.37%
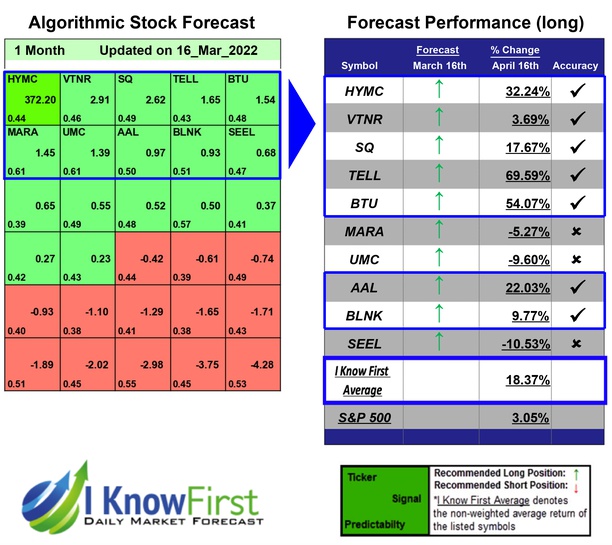
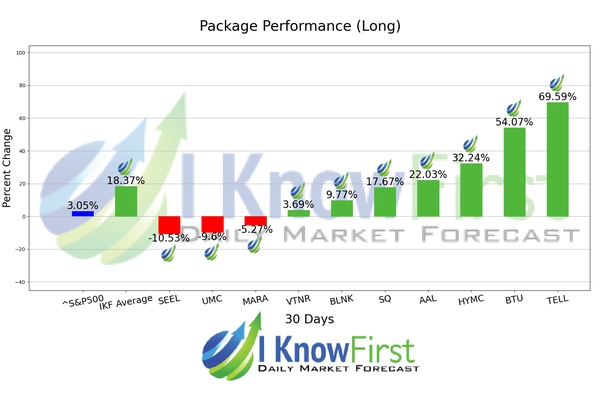
Several predictions in this 1 Month forecast saw significant returns. The algorithm had correctly predicted 7 out of 10 stock movements. TELL was our the best stock pick with a return of 69.59%. Other notable stocks were BTU and HYMC with a return of 54.07% and 32.24%. The package had an overall average return of 18.37%, providing investors with a 15.32% premium over the S&P 500’s return of 3.05% during the period.
Tellurian Inc., formerly Magellan Petroleum Corporation, incorporated on August 17, 1967, is an oil and gas exploration and production company. The Company focuses on the development of liquefied natural gas (LNG) projects along the United States Gulf Coast through its subsidiary, Tellurian Investments Inc.
The Company owns interests in the Horse Hill-1 well and related licenses in the Weald Basin, onshore the United Kingdom, and an exploration block, NT/P82, in the Bonaparte Basin, offshore Northern Territory, Australia. The Horse Hill-1 well has identified prospects from the Portland sandstone and Kimmeridge Clay limestone formations. The Company seeks on developing, through Tellurian LNG and Tellurian LNG’s wholly owned subsidiaries, a liquefied natural gas (LNG) facility with liquefaction capacity of 26 million tonnes per annum on a single site in Calcasieu Parish, Louisiana (the Driftwood LNG Project).
Algorithmic traders utilize these daily forecasts by the I Know First market prediction system as a tool to enhance portfolio performance, verify their own analysis and act on market opportunities faster. This forecast was sent to current I Know First subscribers.
How to interpret this diagram
Algorithmic Stock Forecast: The table on the left is a stock forecast produced by I Know First’s algorithm. Each day, subscribers receive forecasts for six different time horizons. Note that the top 10 stocks in the 1-month forecast may be different than those in the 1-year forecast. In the included table, only the relevant stocks have been included. The boxes are arranged according to their respective signal and predictability values (see below for detailed definitions). A green box represents a positive forecast, suggesting a long position, while a red represents a negative forecast, suggesting a short position.
Please note-for trading decisions use the most recent forecast. Get today’s forecast and Top stock picks.


