Home Builders Stocks Based on Deep Learning: Returns up to 31.76% in 3 Days
Home Builders Stocks
This Home Builders Stocks Package is designed for investors and analysts who need predictions of the best performing stocks for the whole Home Builders sector. It includes 20 stocks with bullish and bearish signals and indicates the best Home Builders stocks to buy:
- Top 10 Home Builders stocks for the long position
- Top 10 Home Builders stocks for the short position
Package Name: Home Builders
Recommended Positions: Long
Forecast Length: 3 Days (4/24/2020 – 4/28/2020)
I Know First Average: 13.34%
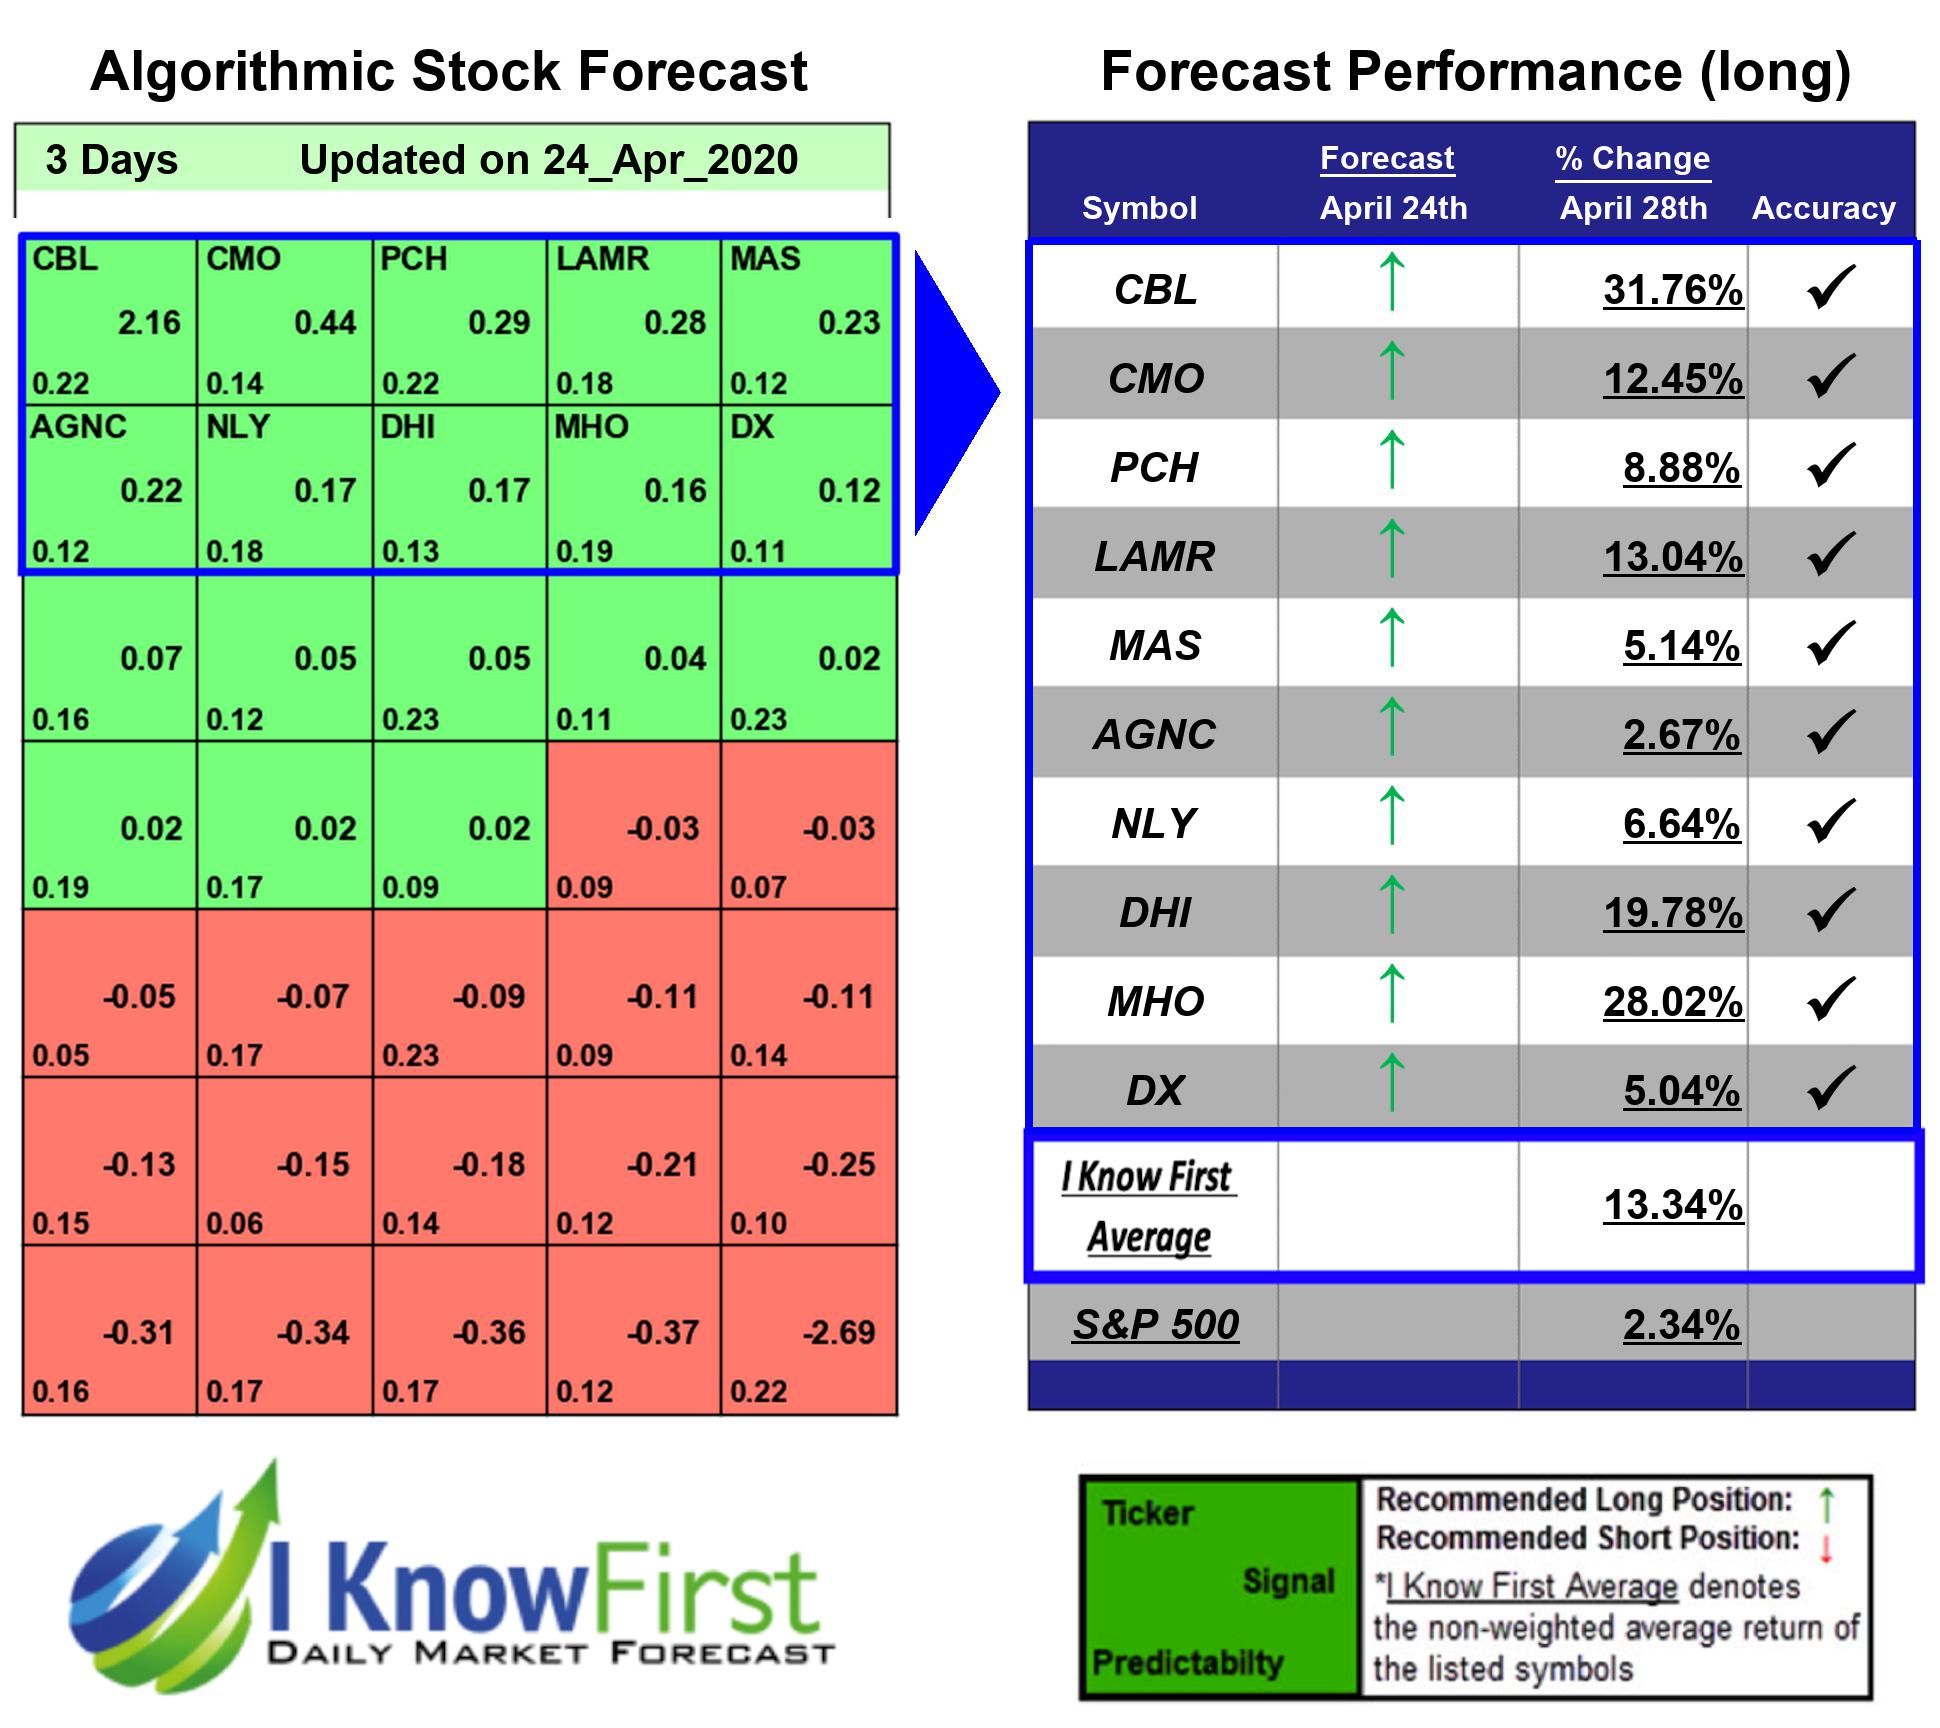
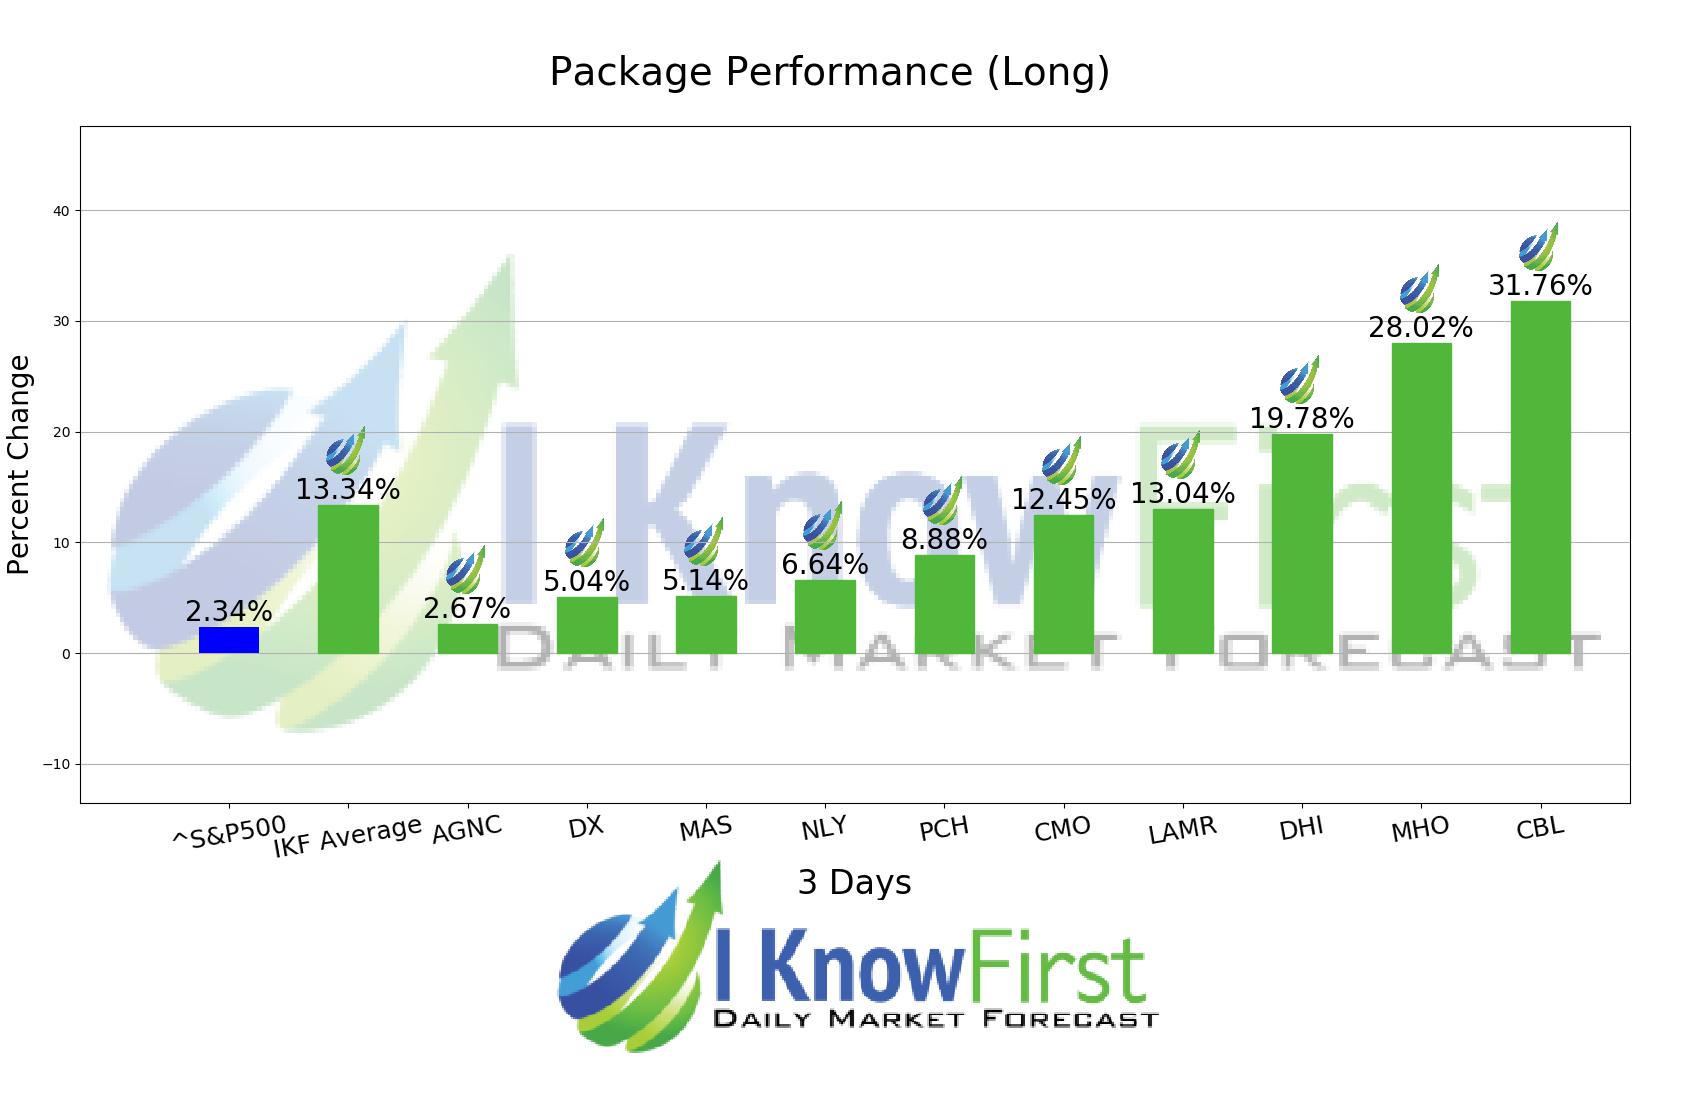
In this 3 Days forecast for the Home Builders Package, there were many high performing trades and the algorithm correctly predicted 10 out 10 trades. The top performing prediction from this package was CBL with a return of 31.76%. MHO and DHI saw outstanding returns of 28.02% and 19.78%. The package itself saw an overall return of 13.34%, providing investors with a 11.00% premium above the S&P 500’s return of 2.34% for the same time period.
CBL & Associates Properties, Inc. (CBL) is a public real estate investment trust. It engages in acquisition, development, and management of properties. The fund invests in the real estate markets of United States. Its portfolio consists of enclosed malls and open-air centers. CBL & Associates Properties is based in Oak Brook, Illinois. CBL & Associates Properties was founded in 1978 and is based in Chattanooga, Tennessee with additional offices in Waltham, Massachusetts; Chesterfield, Missouri; and Irving, Texas.
Algorithmic traders utilize these daily forecasts by the I Know First market prediction system as a tool to enhance portfolio performance, verify their own analysis and act on market opportunities faster. This forecast was sent to current I Know First subscribers.
How to interpret this diagram
Algorithmic Stock Forecast: The table on the left is a stock forecast produced by I Know First’s algorithm. Each day, subscribers receive forecasts for six different time horizons. Note that the top 10 stocks in the 1-month forecast may be different than those in the 1-year forecast. In the included table, only the relevant stocks have been included. The boxes are arranged according to their respective signal and predictability values (see below for detailed definitions). A green box represents a positive forecast, suggesting a long position, while a red represents a negative forecast, suggesting a short position.
Please note-for trading decisions use the most recent forecast. Get today’s forecast and Top stock picks.