Home Builders Stocks Based on Deep-Learning: Returns up to 12.63% in 3 Days
Home Builders Stocks
This Home Builders Stocks Package is designed for investors and analysts who need predictions of the best performing stocks for the whole sector. It includes 20 stocks with bullish and bearish signals and indicates the best Home Builders stocks to buy:
- Top 10 Home Builders stocks for the long position
- Top 10 Home Builders stocks for the short position
Package Name: Home Builders
Recommended Positions: Long
Forecast Length: 3 Days (4/28/23 – 5/1/23)
I Know First Average: 2.01%

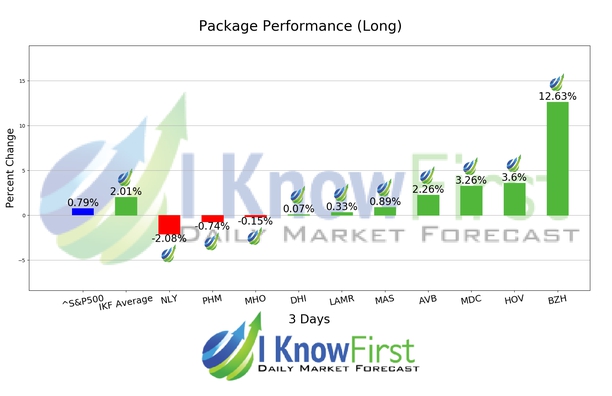
For this 3 Days forecast the algorithm has successfully predicted 7 out of 10 movements. The prediction with the highest return was BZH, at 12.63%. HOV and MDC had notable returns of 3.6% and 3.26%. The package saw an overall yield of 2.01% versus the S&P 500’s return of 0.79% implying a market premium of 1.22%.
Beazer Homes USA, Inc. (BZH) operates as a homebuilder in the United States. The company designs, constructs, and sells single-family and multi-family homes for entry-level, move-up, or retirement-oriented home buyers under the Beazer Homes brand name. It sells its homes through commissioned new home sales counselors and independent brokers in Arizona, California, Nevada, Texas, Indiana, Maryland/Delaware, Tennessee, Virginia, Florida, Georgia, North Carolina, and South Carolina. Beazer Homes USA, Inc. (BZH) was founded in 1985 and is headquartered in Atlanta, Georgia.
Algorithmic traders utilize these daily forecasts by the I Know First market prediction system as a tool to enhance portfolio performance, verify their own analysis and act on market opportunities faster. This forecast was sent to current I Know First subscribers.
How to interpret this diagram
Algorithmic Stock Forecast: The table on the left is a stock forecast produced by I Know First’s algorithm. Each day, subscribers receive forecasts for six different time horizons. Note that the top 10 stocks in the 1-month forecast may be different than those in the 1-year forecast. In the included table, only the relevant stocks have been included. The boxes are arranged according to their respective signal and predictability values (see below for detailed definitions). A green box represents a positive forecast, suggesting a long position, while a red represents a negative forecast, suggesting a short position.
Please note-for trading decisions use the most recent forecast. Get today’s forecast and Top stock picks.