
High Volume Low Price Stocks Based on Deep Learning: Returns up to 654.84% in 1 Year
High Volume Low Price Stocks
The High Volume Low Price Stocks Package is designed for investors and analysts who need predictions for stocks currently trading between $5 and $10, and with an average daily trading volume above one million dollars. It includes 20 stocks with bullish and bearish signals and indicates the best shares to buy and sell:
- Low Price High Volume Stocks Top 10 stocks for the long position
- Low Price High Volume Stocks Top 10 stocks for the short position

Package Name: Low Price High Volume Stocks
Recommended Positions: Long
Forecast Length: 1 Year (4/17/20 – 4/18/21)
I Know First Average: 193.62%
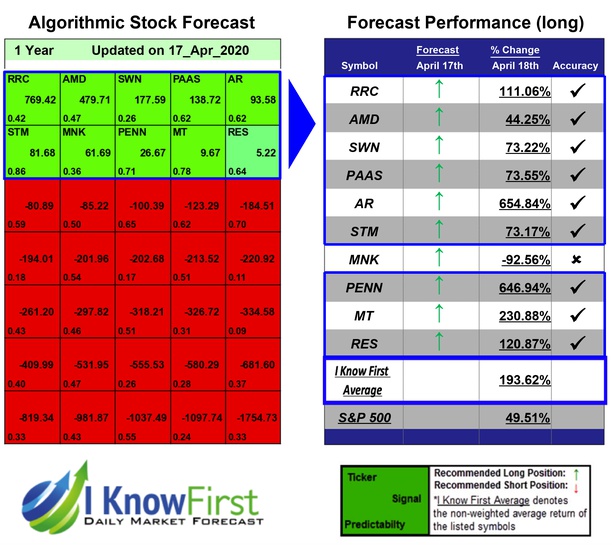
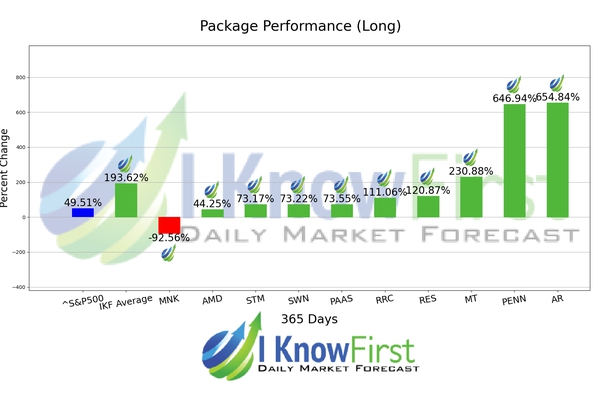
In this 1 Year forecast for the Low Price High Volume Stocks Package, there were many high-performing trades, and the algorithm correctly predicted 9 out of 10 trades. The top-performing prediction in this forecast was AR, which registered a return of 654.84%. PENN, and MT had notable returns of 646.94% and 230.88%. With these notable trade returns, the package itself registered an average return of 193.62% compared to the S&P 500’s return of 49.51% for the same period.
Algorithmic traders utilize these daily forecasts by the I Know First market prediction system as a tool to enhance portfolio performance, verify their own analysis and act on market opportunities faster. This forecast was sent to current I Know First subscribers.
How to interpret this diagram
Algorithmic Stock Forecast: The table on the left is a stock forecast produced by I Know First’s algorithm. Each day, subscribers receive forecasts for six different time horizons. Note that the top 10 stocks in the 1-month forecast may be different than those in the 1-year forecast. In the included table, only the relevant stocks have been included. The boxes are arranged according to their respective signal and predictability values (see below for detailed definitions). A green box represents a positive forecast, suggesting a long position, while a red represents a negative forecast, suggesting a short position.
Please note-for trading decisions use the most recent forecast. Get today’s forecast and Top stock picks.


