
Hedge Fund Stocks Based on a Self-learning Algorithm: Returns up to 21.92% in 1 Month
Hedge Fund Stocks
This Hedge Fund Stocks Package is designed for investors and analysts who need predictions of the best-performing stocks according to I Know First’s stock market algorithm. It includes 20 stocks with bullish and bearish signals and indicates the best stocks to long and short based on artificial intelligence trading strategies:
- Top 10 Hedge Fund stocks for the long position
- Top 10 Hedge Fund stocks for the short position

Package Name: Hedge Fund Stocks
Recommended Positions: Long
Forecast Length: 1 Month (10/2/2020 – 11/2/2020)
I Know First Average: 6.87%
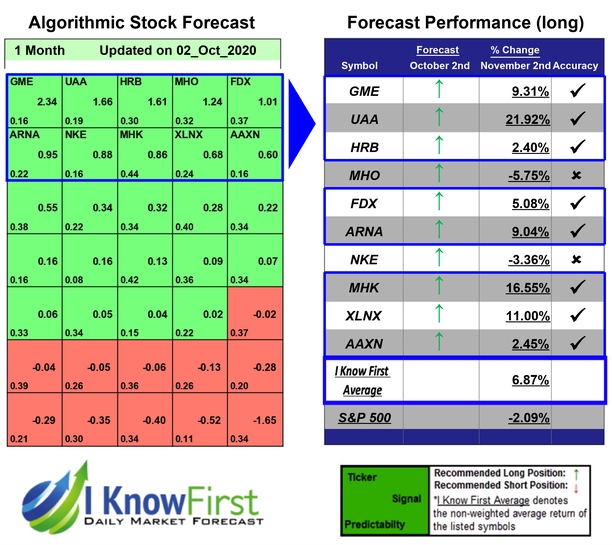
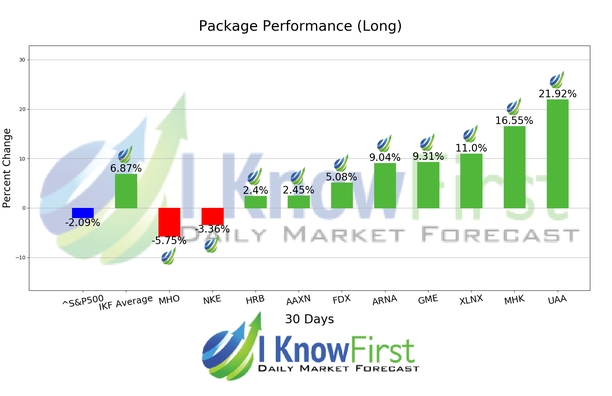
This Hedge Fund Stocks Package forecast had correctly predicted 8 out of 10 stock movements. The top-performing prediction in this forecast was UAA, which registered a return of 21.92%. Additional high returns came from MHK and XLNX, at 16.55% and 11.0% respectively. The package had an overall average return of 6.87%, providing investors with a 8.96% premium over the S&P 500’s return of -2.09% during the period.
Under Armour, Inc., together with its subsidiaries, develops, markets, and distributes branded performance apparel, footwear, and accessories for men, women, and youth primarily in North America, Europe, the Middle East, Africa, the Asia-Pacific, and Latin America. The company offers its apparel in compression, fitted, and loose types to be worn in hot, cold, and in between the extremes.
Algorithmic traders utilize these daily forecasts by the I Know First market prediction system as a tool to enhance portfolio performance, verify their own analysis and act on market opportunities faster. This forecast was sent to current I Know First subscribers.
How to interpret this diagram
Algorithmic Stock Forecast: The table on the left is a stock forecast produced by I Know First’s algorithm. Each day, subscribers receive forecasts for six different time horizons. Note that the top 10 stocks in the 1-month forecast may be different than those in the 1-year forecast. In the included table, only the relevant stocks have been included. The boxes are arranged according to their respective signal and predictability values (see below for detailed definitions). A green box represents a positive forecast, suggesting a long position, while a red represents a negative forecast, suggesting a short position.
Please note-for trading decisions use the most recent forecast. Get today’s forecast and Top stock picks.


