
Energy Stocks Based on a Self-learning Algorithm: Returns up to 28.24% in 3 Days
Energy Stocks
The Energy Stocks Package is based on the I Know First algorithm and is designed for investors and analysts who need recommendations for the best performing stocks for the whole Energy Industry. It includes 20 stocks with bullish and bearish signals and indicates the best stocks to buy and sell:
- Top 10 Energy stocks for the long position
- Top 10 Energy stocks for the short position

Package Name: Energy Stocks Forecast
Recommended Positions: Long
Forecast Length: 3 Days (2/7/21 – 2/11/21)
I Know First Average: 8.09%
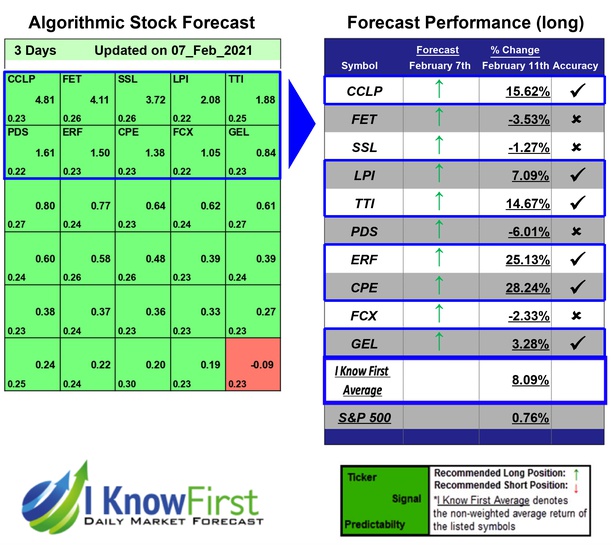
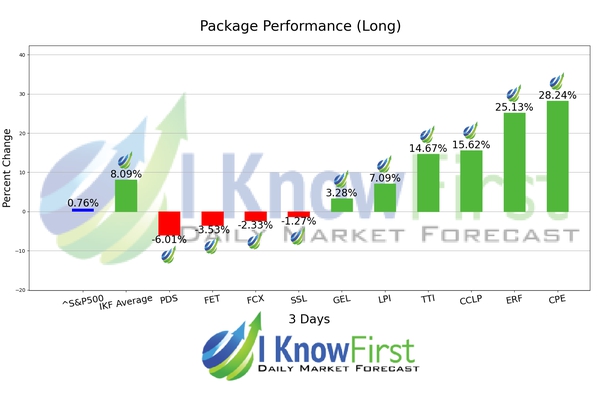
This Energy Stocks Forecast Package forecast had correctly predicted 6 out of 10 stock movements. CPE was the highest-earning trade with a return of 28.24% in 3 Days. The suggested trades for ERF and CCLP also had notable 3 Days yields of 25.13% and 15.62%, respectively. With these notable trade returns, the package itself registered an average return of 8.09% compared to the S&P 500’s return of 0.76% for the same period.
Callon Petroleum Company (CPE), an independent oil and natural gas company, acquires, explores for, develops, and produces oil and natural gas properties in the Permian Basin in West Texas. As of December 31, 2015, the company estimated net proved reserves totaled 54.3 million barrel of oil equivalent. Callon Petroleum Company (CPE) was founded in 1950 and is headquartered in Natchez, Mississippi.
Algorithmic traders utilize these daily forecasts by the I Know First market prediction system as a tool to enhance portfolio performance, verify their own analysis and act on market opportunities faster. This forecast was sent to current I Know First subscribers.
How to interpret this diagram
Algorithmic Stock Forecast: The table on the left is a stock forecast produced by I Know First’s algorithm. Each day, subscribers receive forecasts for six different time horizons. Note that the top 10 stocks in the 1-month forecast may be different than those in the 1-year forecast. In the included table, only the relevant stocks have been included. The boxes are arranged according to their respective signal and predictability values (see below for detailed definitions). A green box represents a positive forecast, suggesting a long position, while a red represents a negative forecast, suggesting a short position.
Please note-for trading decisions use the most recent forecast. Get today’s forecast and Top stock picks.


