
Dividend Stocks Based on Artificial Intelligence: Returns up to 52.73% in 14 Days
Dividend Stocks
This forecast is part of the Dividends Package, as one of I Know First’s quantitative investment solutions. We determine the best stocks carrying a dividend by screening our database daily using our advanced algorithm. The full Dividends Package includes a daily forecast for a total of 20 stocks with bullish and bearish signals:
- Top 10 Dividend stocks for the long position
- Top 10 Dividend stocks for the short position

Package Name: Dividend Stocks Forecast
Recommended Positions: Long
Forecast Length: 14 Days (4/15/2020 – 4/29/2020)
I Know First Average: 15.84%
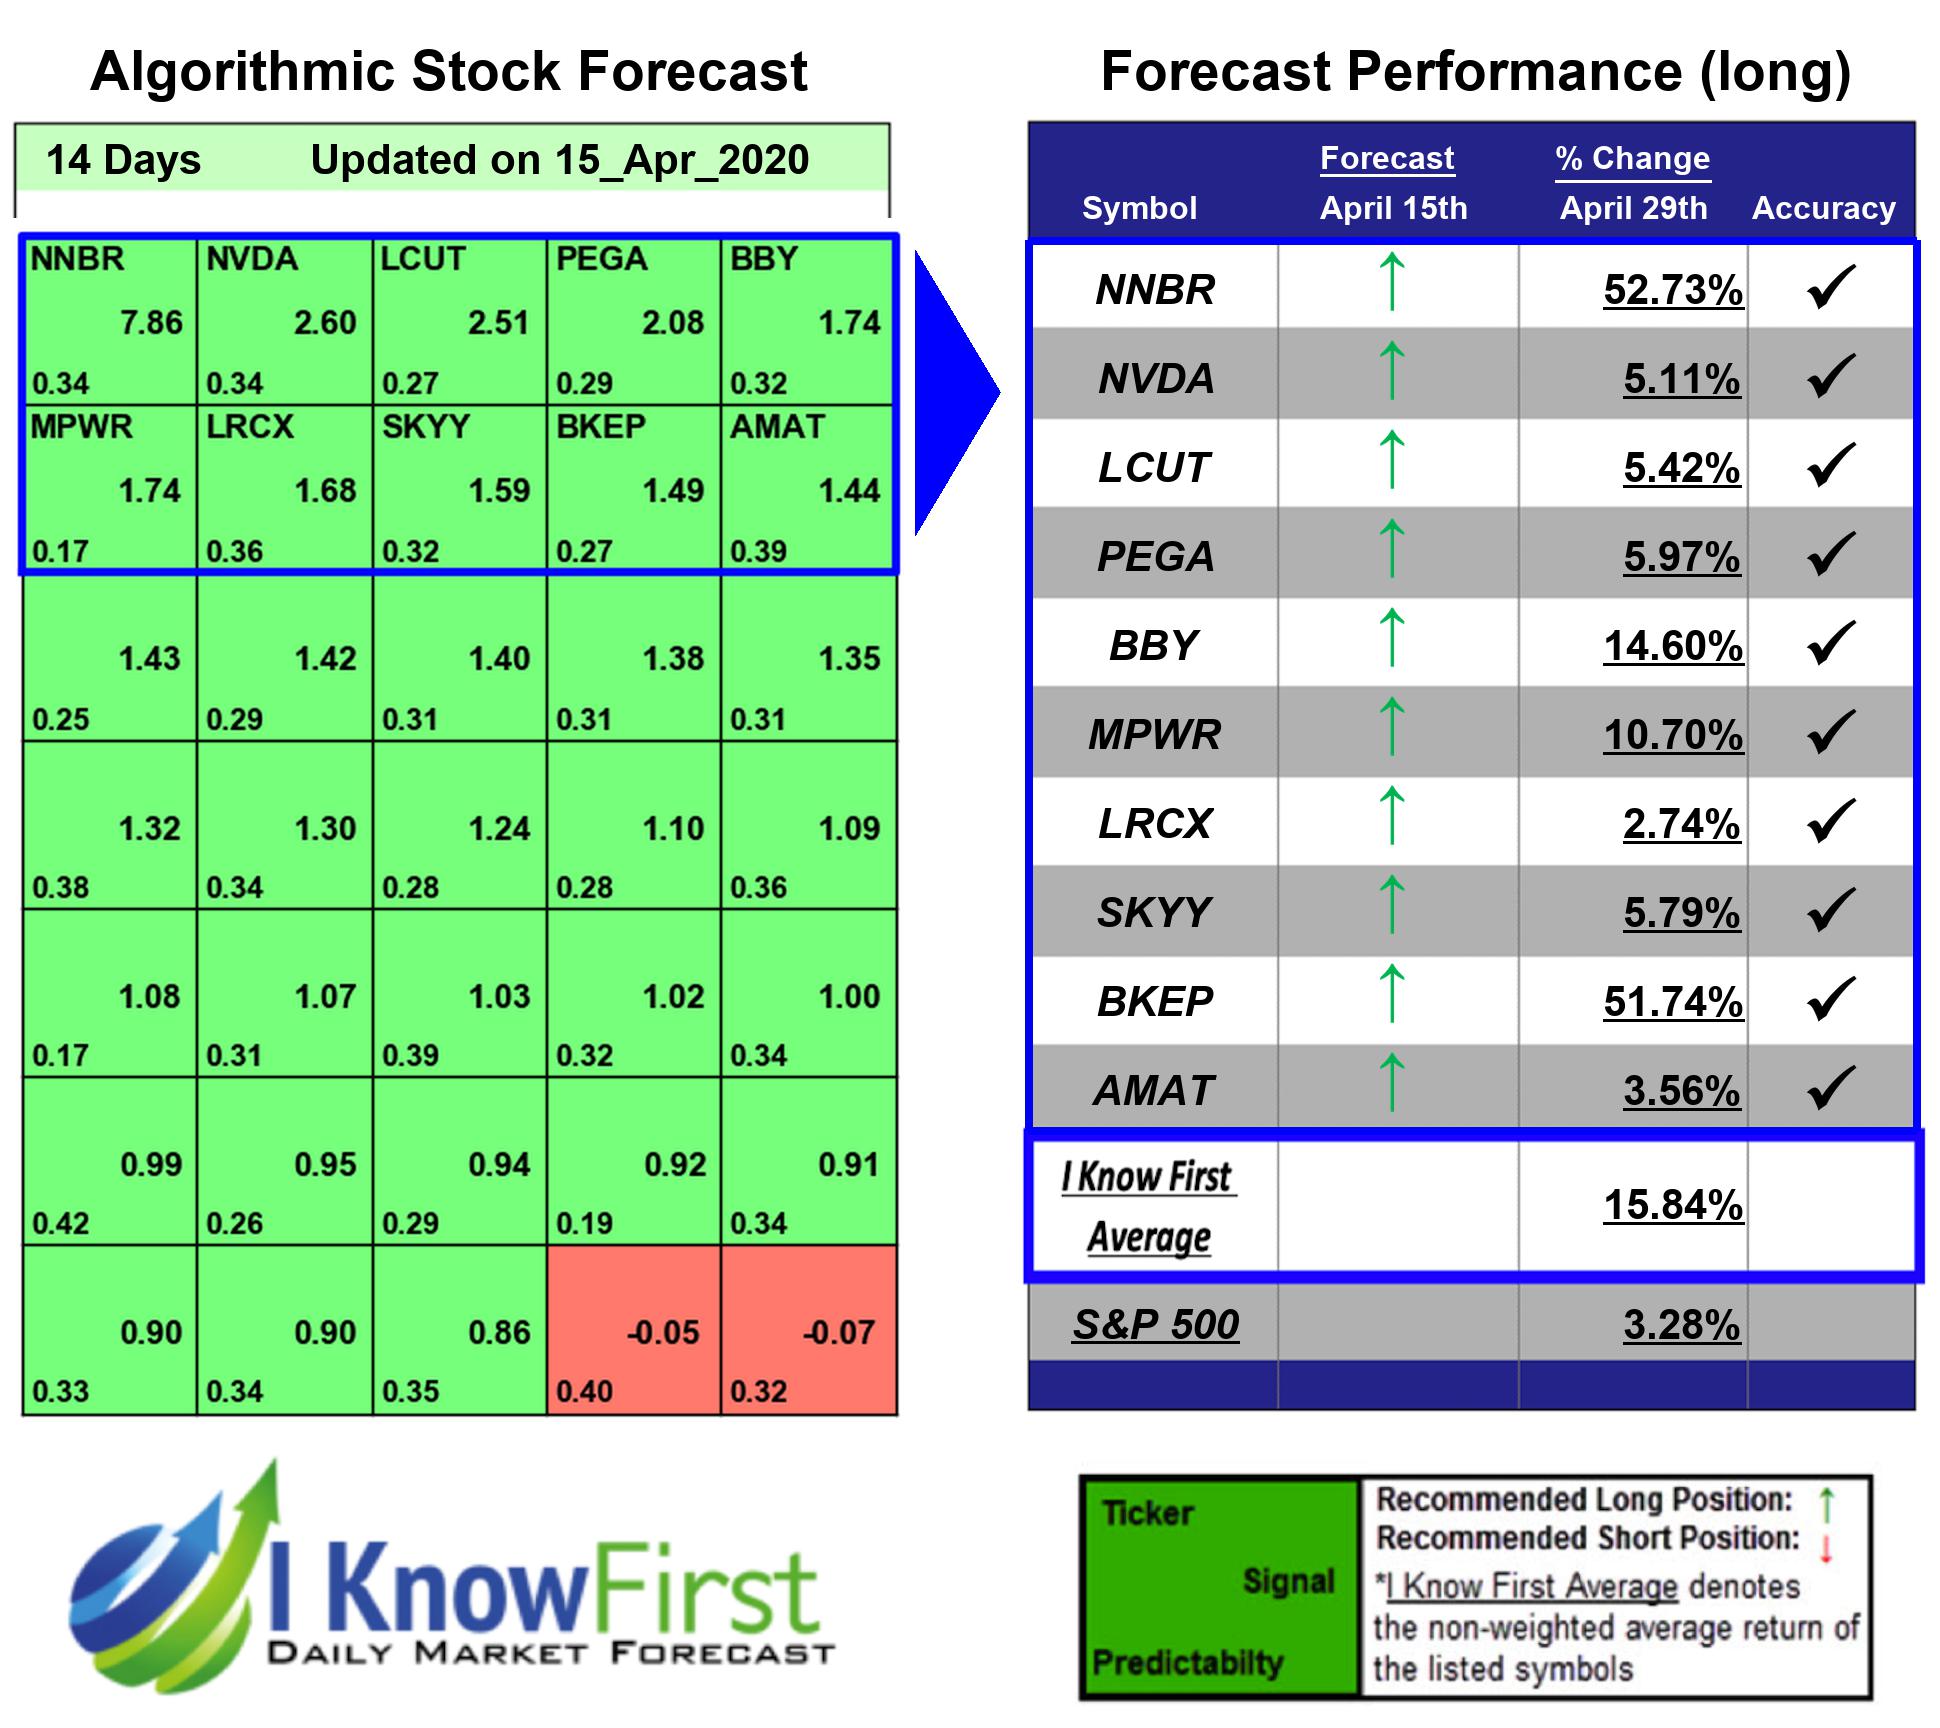

I Know First’s State of the Art Algorithm accurately forecasted 10 out of 10 trades in this Dividend Stocks Forecast Package for the 14 Days time period. NNBR was the top performing prediction with a return of 52.73%. Additional high returns came from BKEP and BBY, at 51.74% and 14.6% respectively. The package had an overall average return of 15.84%, providing investors with a 12.56% premium over the S&P 500’s return of 3.28% during the period.
NN, Inc., incorporated on October 12, 1993, is a diversified industrial company and a global manufacturer of high precision components and assemblies to a range of markets on a global basis. The Company’s operating segments include: the Precision Engineered Products Group and the Autocam Precision Components Group.
Algorithmic traders utilize these daily forecasts by the I Know First market prediction system as a tool to enhance portfolio performance, verify their own analysis and act on market opportunities faster. This forecast was sent to current I Know First subscribers.
How to interpret this diagram
Algorithmic Stock Forecast: The table on the left is a stock forecast produced by I Know First’s algorithm. Each day, subscribers receive forecasts for six different time horizons. Note that the top 10 stocks in the 1-month forecast may be different than those in the 1-year forecast. In the included table, only the relevant stocks have been included. The boxes are arranged according to their respective signal and predictability values (see below for detailed definitions). A green box represents a positive forecast, suggesting a long position, while a red represents a negative forecast, suggesting a short position.
Please note-for trading decisions use the most recent forecast. Get today’s forecast and Top stock picks.


