
Coronavirus Stock Market Forecast Based on Stock Prediction Algorithm: Returns up to 385.81% in 1 Year
Coronavirus Stock Market Forecast
This Coronavirus Stock Market Forecast identifies the most affected stocks in negative way while also highlighting the opportunities arising in the stock market during these extraordinary market situation. The package covers the assets that may be affected by the coronavirus with the biggest financial exposures and it includes assets such as gold and relevant commodities, biotech companies’ stocks, pharmaceutical companies’ stocks, semiconductors and technological sectors stocks and more.
- Top 10 stocks for the long position
- Top 10 stocks for the short position
Package Name: Coronavirus Stock Market Forecast
Recommended Positions: Long
Forecast Length: 1 Year (10/27/20 – 10/27/21)
I Know First Average: 68.6%
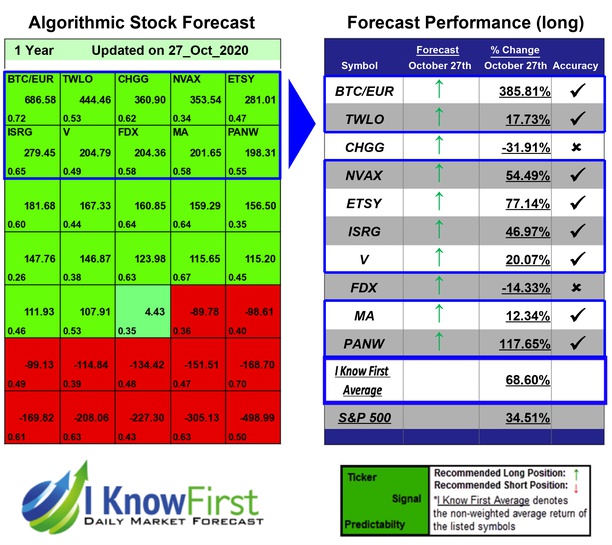
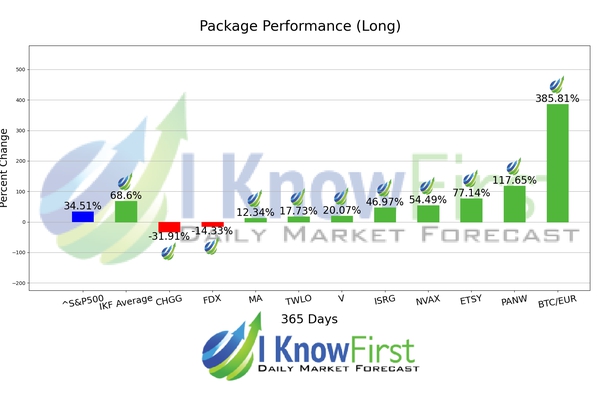
This Coronavirus Stock Market Forecast Package forecast had correctly predicted 8 out of 10 stock movements. The greatest return came from BTC/EUR at 385.81%. PANW and ETSY also performed well for this time horizon with returns of 117.65% and 77.14%, respectively. The package had an overall average return of 68.6%, providing investors with a premium of 34.09% over the S&P 500’s return of 34.51% during the same period.
Algorithmic traders utilize these daily forecasts by the I Know First market prediction system as a tool to enhance portfolio performance, verify their own analysis and act on market opportunities faster. This forecast was sent to current I Know First subscribers.
How to interpret this diagram
Algorithmic Stock Forecast: The table on the left is a stock forecast produced by I Know First’s algorithm. Each day, subscribers receive forecasts for six different time horizons. Note that the top 10 stocks in the 1-month forecast may be different than those in the 1-year forecast. In the included table, only the relevant stocks have been included. The boxes are arranged according to their respective signal and predictability values (see below for detailed definitions). A green box represents a positive forecast, suggesting a long position, while a red represents a negative forecast, suggesting a short position.
Please note-for trading decisions use the most recent forecast. Get today’s forecast and Top stock picks.


