Consumer Stocks Based on Deep Learning: Returns up to 15.19% in 3 Days
Consumer Stocks
The Consumer Stocks Package is designed for investors and analysts who need predictions of the best performing stocks for the whole Consumer Industry. It includes 20 stocks with bullish and bearish signals.
- Top 10 Consumer stocks for the long position
- Top 10 Consumer stocks for the short position
Package Name: Consumer Stocks
Recommended Positions: Long
Forecast Length: 3 Days (10/3/2019 – 10/6/2019)
I Know First Average: 2.66%
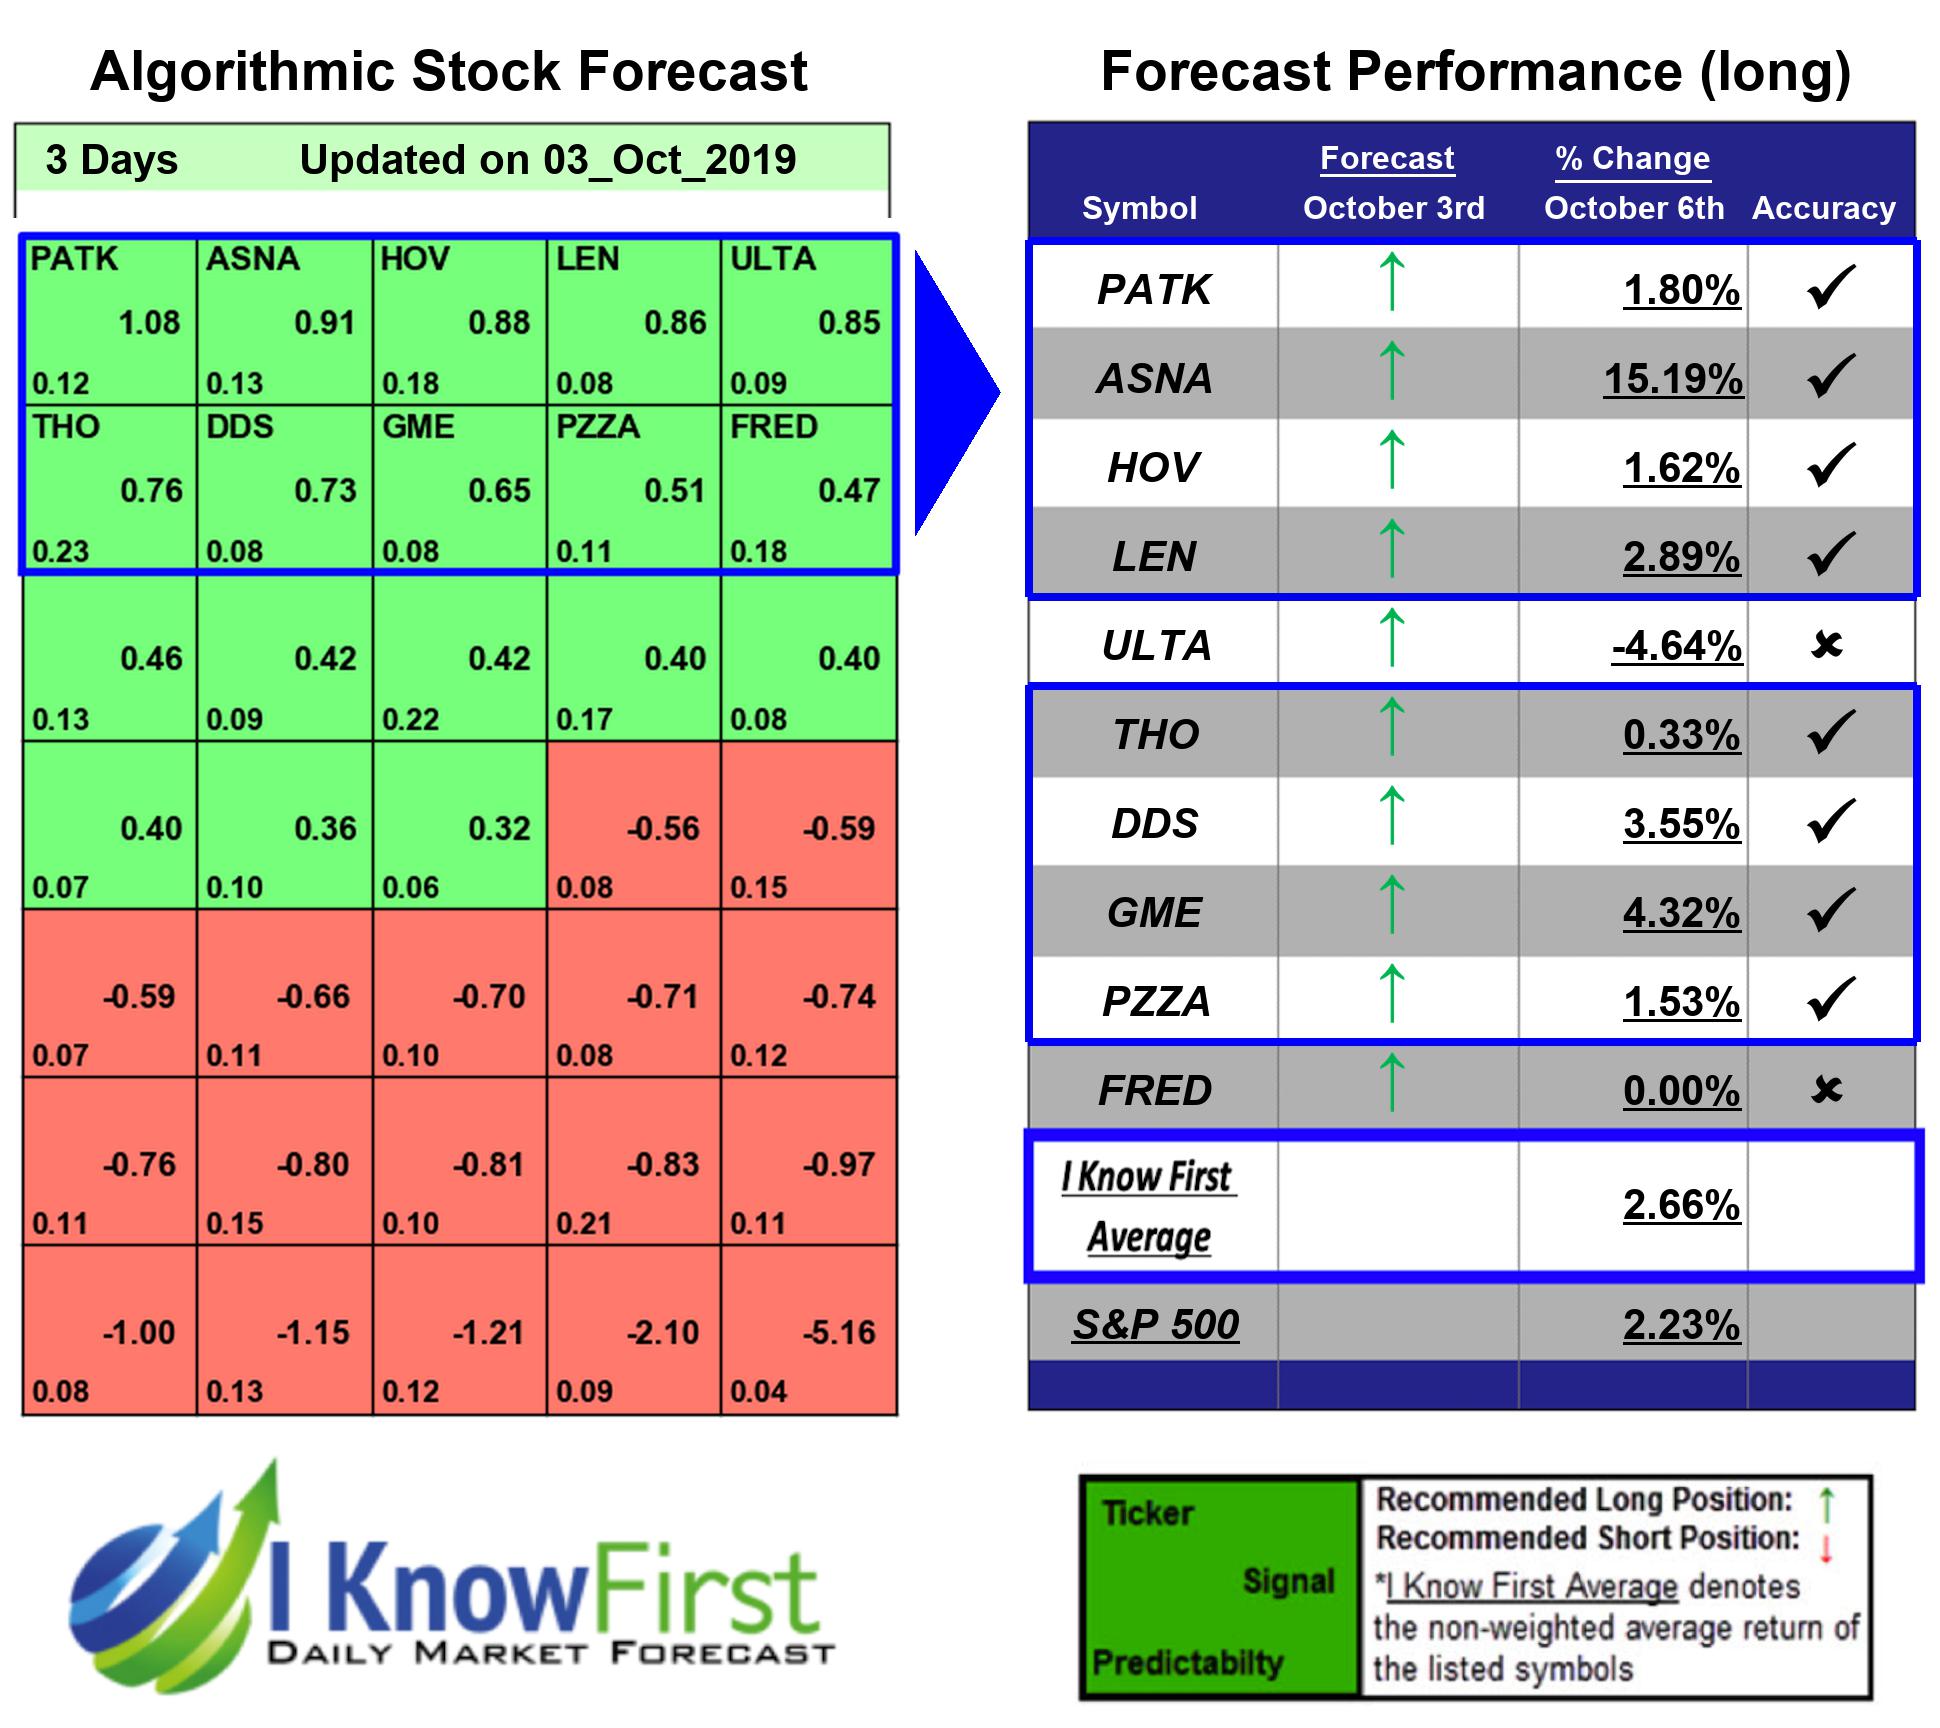

The algorithm correctly predicted 8 out 10 of the suggested trades in the Consumer Stocks Package for this 3 Days forecast. The top performing prediction from this package was ASNA with a return of 15.19%. Other notable stocks were GME and DDS with a return of 4.32% and 3.55%. The package saw an overall yield of 2.66% versus the S&P 500’s return of 2.23% implying a market premium of 0.43%.
Ascena Retail Group, Inc., incorporated on July 27, 2010, is a specialty retailer of apparel for women and tween girls. The Company classifies its businesses into six segments: ANN, Justice, Lane Bryant, maurices, dressbarn and Catherines. As of July 30, 2016, the Company operated approximately 4,900 stores in 49 United States’ states, the District of Columbia, Canada and Puerto Rico.
Algorithmic traders utilize these daily forecasts by the I Know First market prediction system as a tool to enhance portfolio performance, verify their own analysis and act on market opportunities faster. This forecast was sent to current I Know First subscribers.
How to interpret this diagram
Algorithmic Stock Forecast: The table on the left is a stock forecast produced by I Know First’s algorithm. Each day, subscribers receive forecasts for six different time horizons. Note that the top 10 stocks in the 1-month forecast may be different than those in the 1-year forecast. In the included table, only the relevant stocks have been included. The boxes are arranged according to their respective signal and predictability values (see below for detailed definitions). A green box represents a positive forecast, suggesting a long position, while a red represents a negative forecast, suggesting a short position.
Please note-for trading decisions use the most recent forecast. Get today’s forecast and Top stock picks.