
CDNS Stock Forecast: Is There a Price Too High for Quality?
 This “CDNS Stock Forecast: is there a price too high for quality” article was written by Rafi Rees – Financial Analyst at I Know First.
Highlights:
- Cadence design Systems has returned 300% to shareholders over the last 5 years.
- Despite excellence on the operations front, a valuation analysis suggests that this is a high-quality company trading at very premium multiples.
- I fear these multiples may be a little overcooked in the current environment.

Company Overview
Cadence Design Systems is a multinational electronic design automation (EDA) software and engineering services company. The company provides a range of software, hardware, and intellectual property (IP) for designing electronic systems and integrated circuits.
Revenue Analysis
Cadence’s main business model is to provide its customers with a wide range of EDA software and services that help them to design, verify, and implement electronic systems and integrated circuits. The company’s products and services are used in a variety of industries that includes semiconductors, computers, telecommunications, aerospace and defense, and more which has allowed them to diversify their revenue streams by product as well as Geography. Figures 1 and 2 show the revenue split by both product line and geography in 2021. Whilst we are still waiting for FY2022 Q4 data, the updated figures for the first 3 quarters of 2022 are much the same besides for a notable uptick in sales in China as their economy comes back online.


The company’s EDA software is used to design and verify integrated circuits, printed circuit boards and multi-chip modules, and IC packaging, as well as design and verify custom integrated circuits, standard integrated circuits, and application-specific integrated circuits.
Cadence also provide engineering services, including technical support, training, consulting and methodology development services, and intellectual property. These services help customers to optimize their design and verification flows, and to improve the performance, power and cost of their electronic systems and integrated circuits.
It appears that most of Cadence’s revenue – approximately 85-90%, is from repeat customers, indicating broad satisfaction with the product. Furthermore, a high operating margin as compared to its peers alongside a very healthy return on investment points to a large moat that is difficult for newcomers to innovate over.

This moat is likely a result of their strong intellectual property portfolio. They have many patents and proprietary technology in the field of electronic design automation, which can act as a barrier to entry for competitors. Additionally, a wide and diversified customer base in various industries alongside a long-standing reputation in the industry and strong relationships with key customers, can make it difficult for new competitors to gain a foothold in the market.
Boasting a strong balance sheet with little to fault the company for in terms of execution, is this a screaming buy?
Perspectives of the greats
Munger is famously quoted with the following statement: “Over the long term, it is hard for a stock to earn a much better return than the business which underlies it earns. For example, if a business earns 6% on capital over 40 years and holds it for that 40 years, you’re not going to make much different than a 6% return, even if you originally but at a huge discount. Conversely, if a business earns 18% on capital over 20 or 30 years, even if you pay an expensive looking price you’ll end up with a good result.” According to Munger, when you come across a quality business with a deep moat, it doesn’t matter too much what price you pay for it. As long as the returns on investment are high, you should end up with a positive result.
Howard Marks on the other hand, an investor forged in the hysteria of the nifty fifty realised that it’s not what you buy, its what you pay for it that determines whether something is a good investment. In his memo “This time it’s different” he writes; “companies that do have better technology, better earnings prospects and the ability to be disrupters rather than disrupted still aren’t worth infinity.” Investors who put their money in Microsoft at the peak of the dot com bubble will have had to wait 14 years to recoup their initial investment. With this warning heeded, lets look at the valuation of the company.
Valuation Analysis:
A DCF analysis can give us better insight into the intrinsic value of the company. Unfortunately, the analysis Is only as good as its underlying assumptions. Therefore, rather than suggest a singular value that emerges as a result of the DCF, I like to give a range of values that could emerge given a variety of inputs. The point of the DCF isn’t to be 100% accurate, it is to be less wrong than the current market consensus.
My DCF analysis suggests a valuation range between $72 – $114. In the most bullish case, I have forecasted a very strong revenue growth of 12% for the next 5 years falling to 7% in the subsequent 5 with EBIT margins rising to 37%. If we look at the past 5 years, the gross margin is increasing and the cost of R&D and SG&A as a % of revenue is falling. This is typical of software companies in which the cost of development is low, and the scalability is large. The WACC and terminal growth rate used was 10% and 2.5%. In the most bearish case, revenues “only” grew at 8% per year for the first 5 years then 4.8% after that. The gross margins still increased, but only to 33% as R&D expenses remained high. I also used the same WACC but a lower terminal growth rate of 1.5%.
At these valuations, the share price is currently between 35% – 60% overvalued.
How about it’s multiples? Figure 4 shows a variety of multiples for both CDNS and some of its competitors over the last 5 years. On a relative basis, it seems that the industry is trading at a premium with very high multiples ascribed to each of the companies we looked at. With that said, CDNS has maintained the highest multiples of all its competitors in every way you look at it. Particularly worrying to me is the current price/sales multiple of 14 as well as the price/earnings multiple of 67.5. This suggests an earnings yield of just 1.5%, when the current risk-free rate is about 3.5%. These high multiples seem overcooked from my perspective, with CDNS trading above the industry averages, going into an uncertain economic climate can really affect the markets outlook which results in a multiple contraction.
With that said, I believe the following paragraph from this article by Gautam Baid to be particularly attributable to the current situation.
“The market always gives longevity of growth more weight than the absolute growth rate, so stocks with 12 to 15 percent predictable earnings growth for the next ten to fifteen years often have current year price/earnings multiples of 40 to 50. Most new investors are perplexed by this phenomenon, but they learn to appreciate the market’s finer nuances and respect its wisdom with time. Because Investors in such stocks are generally willing to sit out periods of high valuation until earnings catch up, the expensive, high-quality secular growth stocks tend to remain at elevated valuations for extended periods. Markets reward companies that can promise years of consistent earnings growth at a disproportionately high rate.”
I suspect a high-quality company such as Cadence will look perpetually expensive when being analysed in this way, making it difficult for investors to find a reasonable entry point.

Technical Analysis:
Figure 5 displays the CDNS chart with the 50-day, 100-day and 200-day moving average as well as bollinger bands and support (green) and resistance (red) lines. We can see that CDNS has traded in a channel between about $135 and $190. The upwards movement of the 50-day moving average suggests that the stock is currently in an uptrend, however, I expect this uptrend to be short lived as we approach the line of resistance. The Bollinger band reading is another bearish indicator that suggests that the price needs to come down from current levels as it has recently broken out of the top of the range of the upper Bollinger. This will add further downwards pressure and I wouldn’t be shocked to see the price fall to the $135 level in the coming 6 – 12 months.
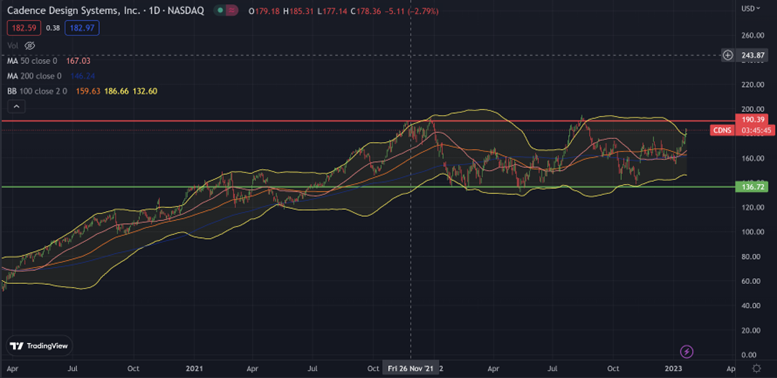
(Figure 5: CDNS chart with indicators)
CDNS Stock Forecast: Conclusion
I think it is important to take the investors time horizon into account when deciding whether this is a buy or a sell. The high quality nature of the company suggests that this is the sort of company that you buy and hold forever – one for the coffee can portfolio so to speak, so investors with such a time horizon may be interested in trying to start opening a position, and accumulating on weakness. If however you have a shorter time horizon (6-18 months), I would be a bit more weary about this company. The high multiples leave little room for error operationally and should investors’ expectations of the company’s growth potential change, it could be hit with a severe rerating. There is therefore very little margin of safety therefore I would recommend taking some profits at these levels.

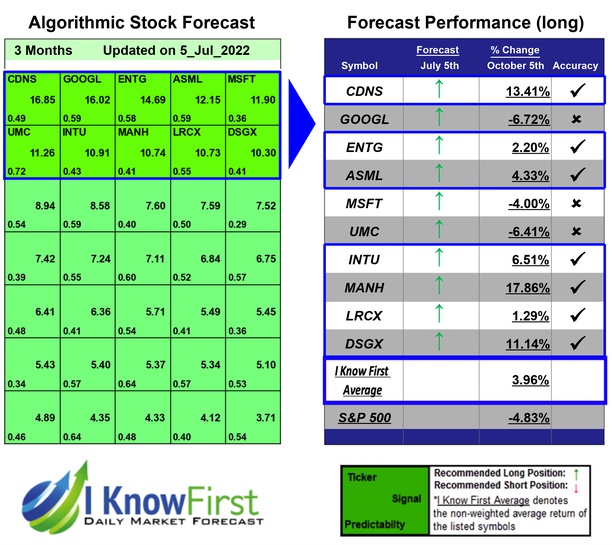
It is worth paying attention that the stock-picking AI of I Know First has a high signal on the one-year market trend forecasts. The light green for the short-term forecasts is mildly bullish, while the darker green is a strong bullish signal for the one-year forecast.
Past Success with CDNS Stock Forecast
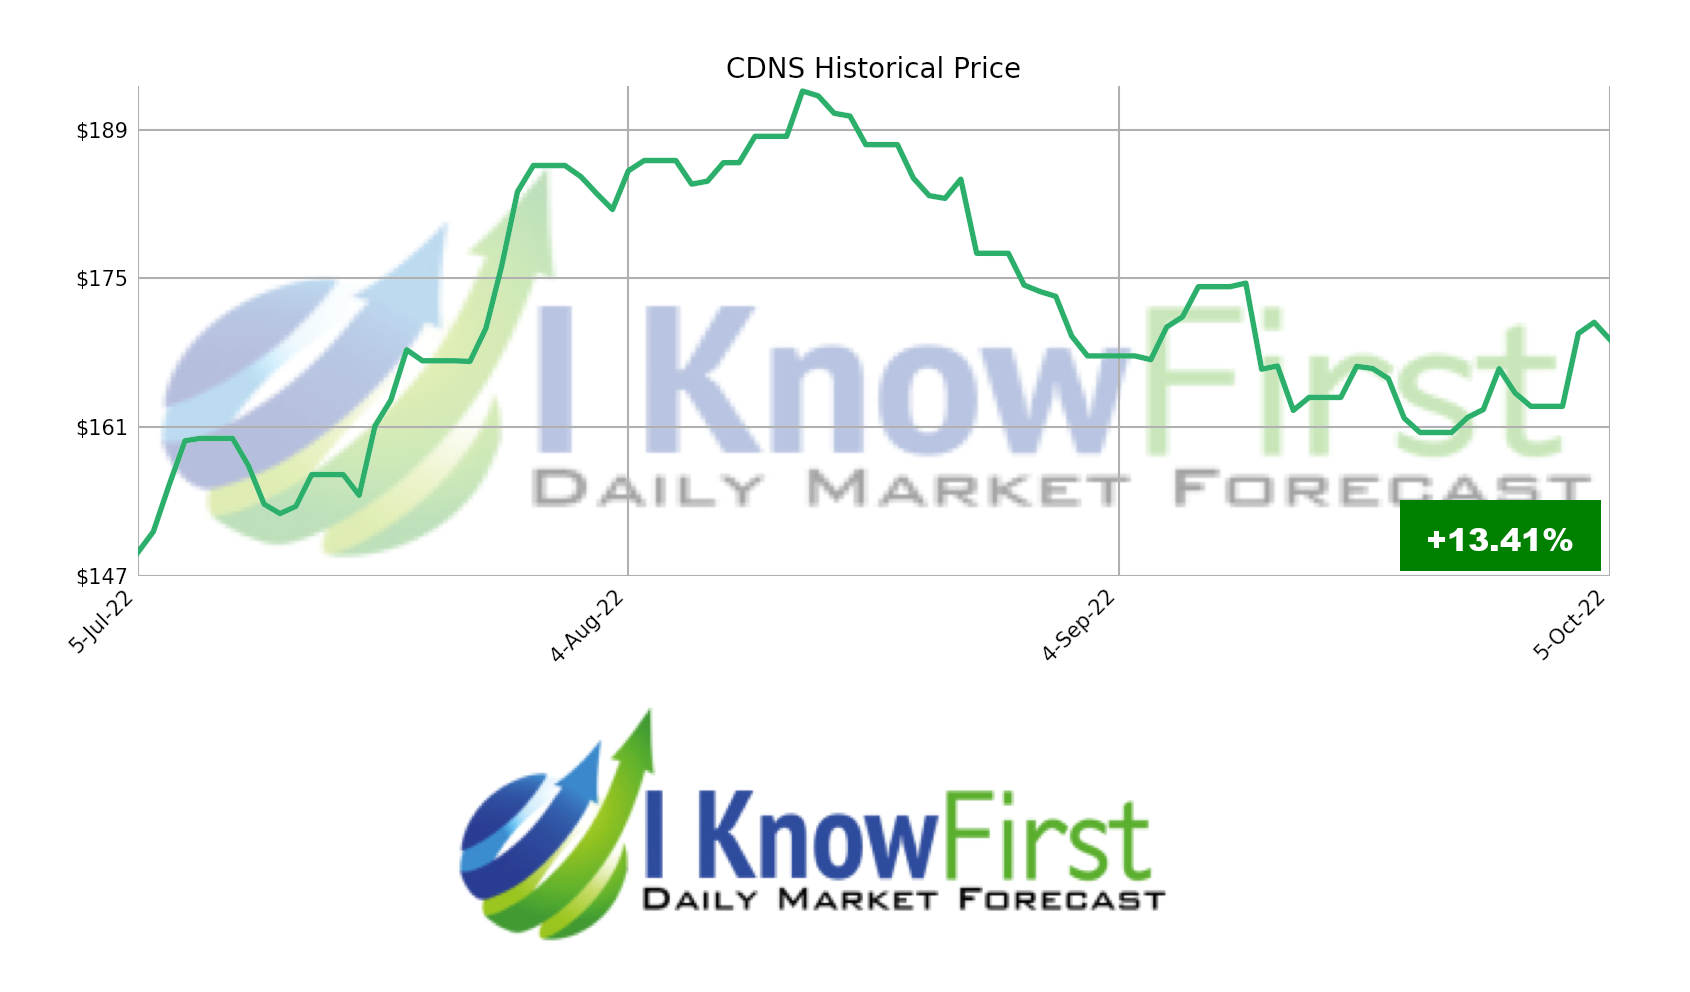
I Know First has been bullish on the CDNS stock forecast in the past. On July 5th, 2022 the I Know First algorithm issued a forecast for CDNS stock price and recommended CDNS as one of the best stocks to buy. The AI-driven CDNS stock prediction was successful on a 3-month time horizon resulting in more than 13.41%.

To subscribe today click here.
Please note-for trading decisions use the most recent forecast.


