
Best Stocks Under 50 Based on Predictive Analytics : Returns up to 15.12% in 3 Days
Best Stocks Under 50
This forecast is part of the Stocks Under 50 Dollars Package, as one of I Know First’s forecast services. The full package includes daily stock predictions for a total of 20 Best Stocks Under 50 stocks with bullish and bearish signals:
- Top 10 stocks for the long position
- Top 10 stocks for the short position
Package Name: Stocks Under $50
Recommended Positions: Long
Forecast Length: 3 Days (11/15/2019 – 11/19/2019)
I Know First Average: 3.67%
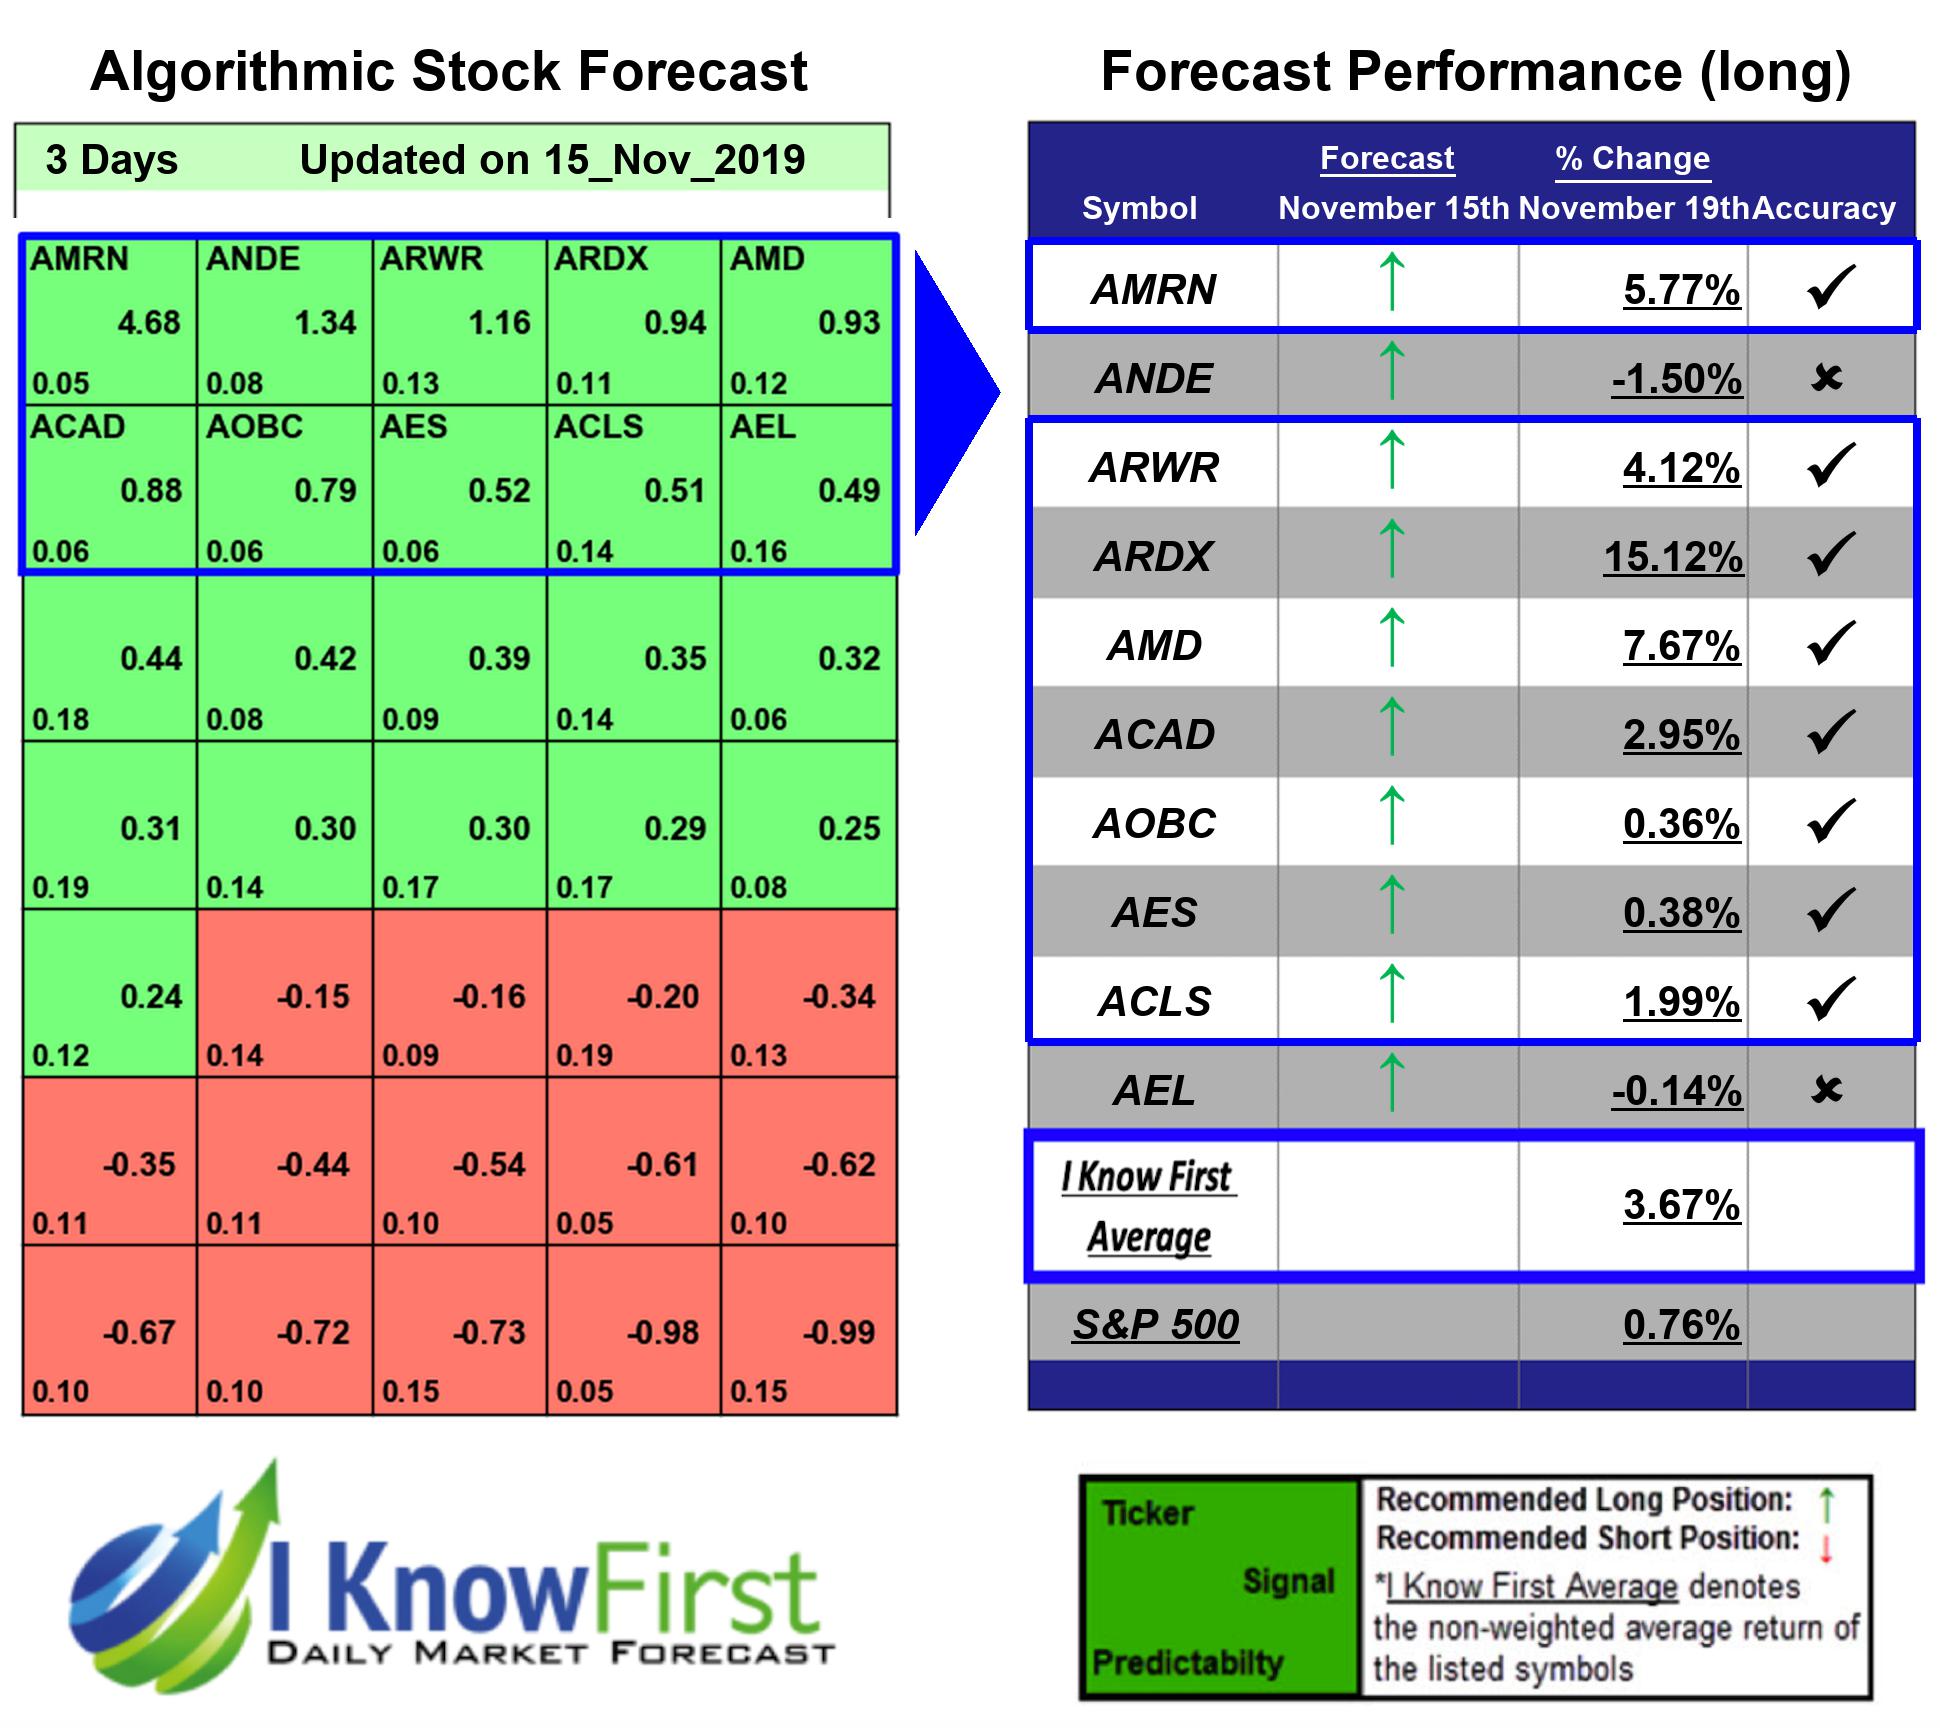

In this 3 Days forecast for the Stocks Under $50 Package, there were many high performing trades and the algorithm correctly predicted 8 out 10 trades. ARDX was the highest-earning trade with a return of 15.12% in 3 Days. Additional high returns came from AMD and AMRN, at 7.67% and 5.77% respectively. The Stocks Under $50 package had an overall average return of 3.67%, providing investors with a premium of 2.91% over the S&P 500’s return of 0.76%.
Ardelyx, Inc., incorporated on October 18, 2007, is a clinical-stage biopharmaceutical company. The Company’s therapeutics focuses on addressing cardiorenal and gastrointestinal (GI) diseases. The Company operates through the research, development and commercialization of biopharmaceutical products segment. The Company’s products line includes cardiorenal portfolio and gastrointestinal portfolio. The cardiorenal portfolio includes tenapanor, RDX7675, RDX013 and RDX011. The gastrointestinal portfolio includes tenapanor, RDX8940, RDX011 and RDX023.
Algorithmic traders utilize these daily forecasts by the I Know First market prediction system as a tool to enhance portfolio performance, verify their own analysis and act on market opportunities faster. This forecast was sent to current I Know First subscribers.
How to interpret this diagram
Algorithmic Stock Forecast: The table on the left is a stock forecast produced by I Know First’s algorithm. Each day, subscribers receive forecasts for six different time horizons. Note that the top 10 stocks in the 1-month forecast may be different than those in the 1-year forecast. In the included table, only the relevant stocks have been included. The boxes are arranged according to their respective signal and predictability values (see below for detailed definitions). A green box represents a positive forecast, suggesting a long position, while a red represents a negative forecast, suggesting a short position.
Please note-for trading decisions use the most recent forecast. Get today’s forecast and Top stock picks.


