
Best Stocks To Buy Based on Pattern Recognition: Returns up to 154.68% in 1 Year
Best Stocks To Buy
This top S&P 500 stocks forecast is designed for investors and analysts who need predictions for the whole S&P 500 (See S&P 500 Companies Package). It includes 20 stocks with bullish and bearish signals and indicates the best S&P 500 Companies stocks to buy:
- Top 10 S&P 500 stocks for the long position
- Top 10 S&P 500 stocks for the short position

Package Name: Top S&P 500 Stocks
Recommended Positions: Long
Forecast Length: 1 Year (1/6/2019 – 1/6/2020)
I Know First Average: 46.08%

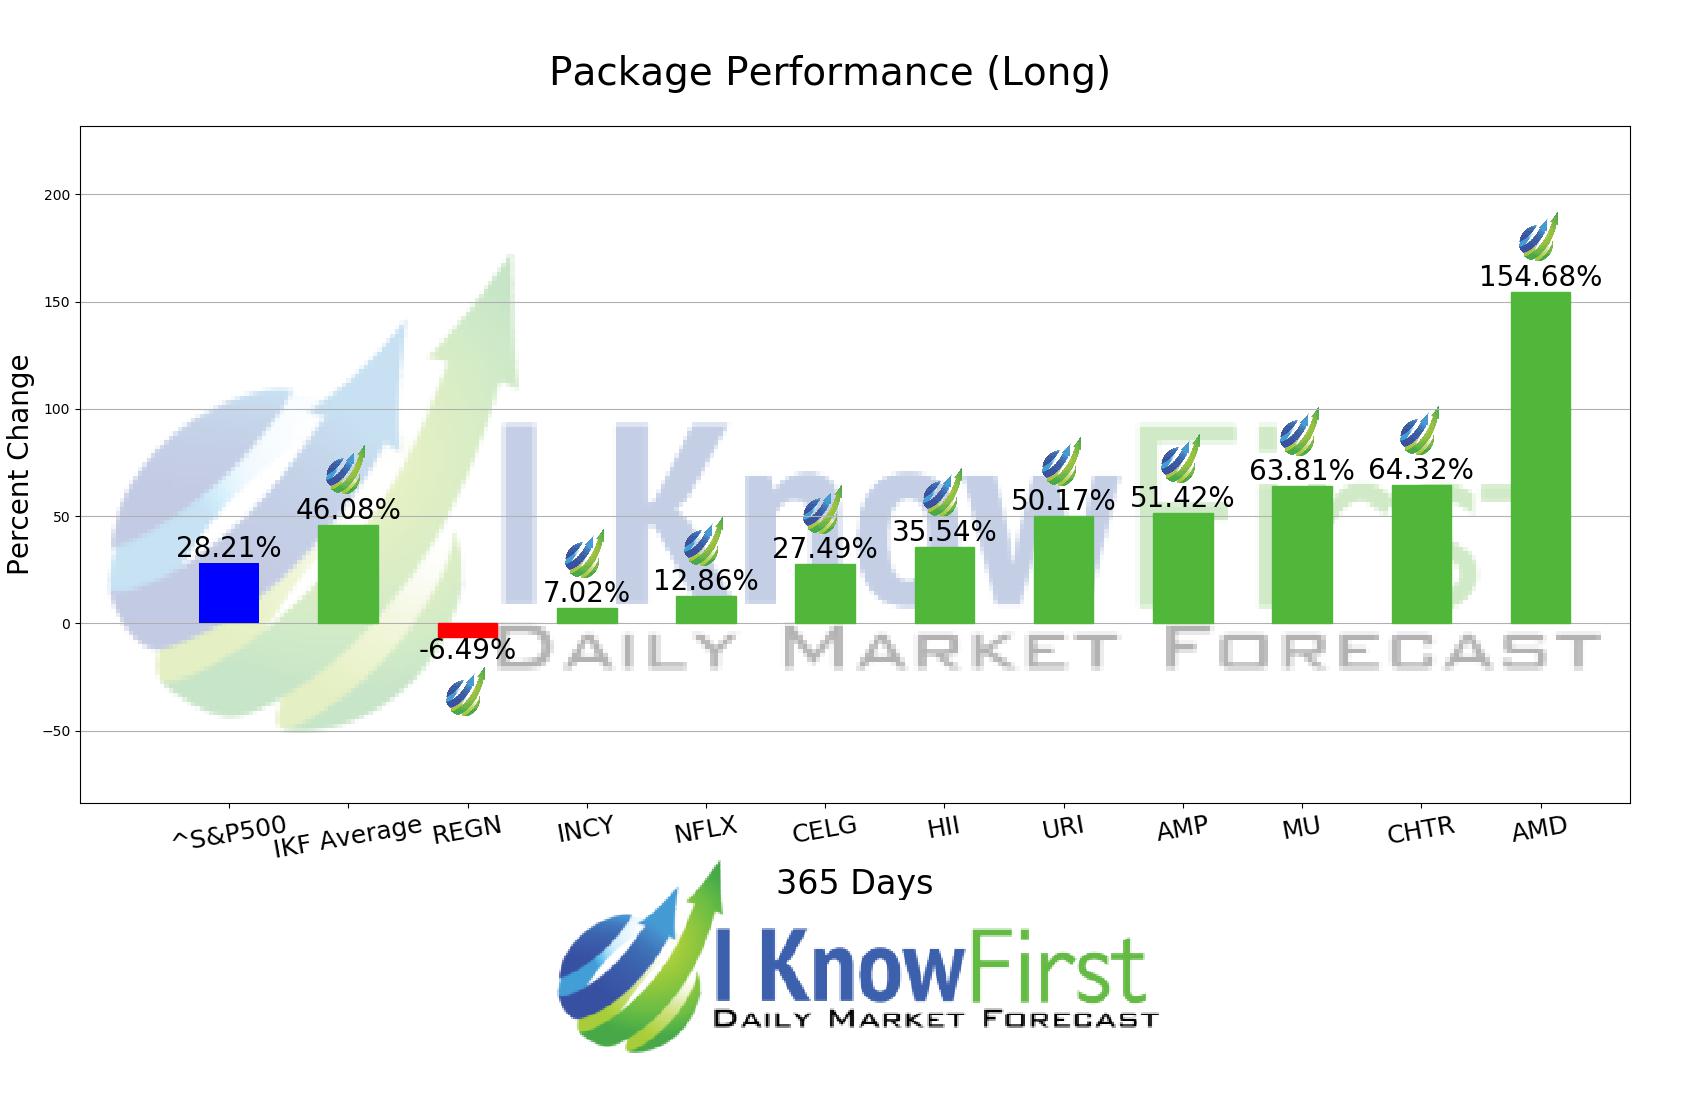
I Know First’s State of the Art Algorithm accurately forecasted 9 out of 10 trades in this Top S&P 500 Stocks Package for the 1 Year time period. The prediction with the highest return was AMD, at 154.68%. Further notable returns came from CHTR and MU at 64.32% and 63.81%, respectively. The package saw an overall yield of 46.08% versus the S&P 500’s return of 28.21% implying a market premium of 17.87%.
Advanced Micro Devices Inc. (AMD) operates as a semiconductor company worldwide. The company’s products include mainly x86 microprocessor as an accelerated processing unit (APU) and graphic process units (GPU). It also provides microprocessors for desktop PCs.
Algorithmic traders utilize these daily forecasts by the I Know First market prediction system as a tool to enhance portfolio performance, verify their own analysis and act on market opportunities faster. This forecast was sent to current I Know First subscribers.
How to interpret this diagram
Algorithmic Stock Forecast: The table on the left is a stock forecast produced by I Know First’s algorithm. Each day, subscribers receive forecasts for six different time horizons. Note that the top 10 stocks in the 1-month forecast may be different than those in the 1-year forecast. In the included table, only the relevant stocks have been included. The boxes are arranged according to their respective signal and predictability values (see below for detailed definitions). A green box represents a positive forecast, suggesting a long position, while a red represents a negative forecast, suggesting a short position.
Please note-for trading decisions use the most recent forecast. Get today’s forecast and Top stock picks.


