
Best Stocks To Buy Based on Deep-Learning: Returns up to 65.3% in 1 Year
Best Stocks To Buy
This top S&P 500 stocks forecast is designed for investors and analysts who need predictions for the whole S&P 500 (See S&P 500 Companies Package). It includes 20 stocks with bullish and bearish signals and indicates the best S&P 500 Companies stocks to buy:
- Top 10 S&P 500 stocks for the long position
- Top 10 S&P 500 stocks for the short position

Package Name: S&P500 Companies
Recommended Positions: Long
Forecast Length: 1 Year (12/18/2018 – 12/18/2019)
I Know First Average: 41.29%
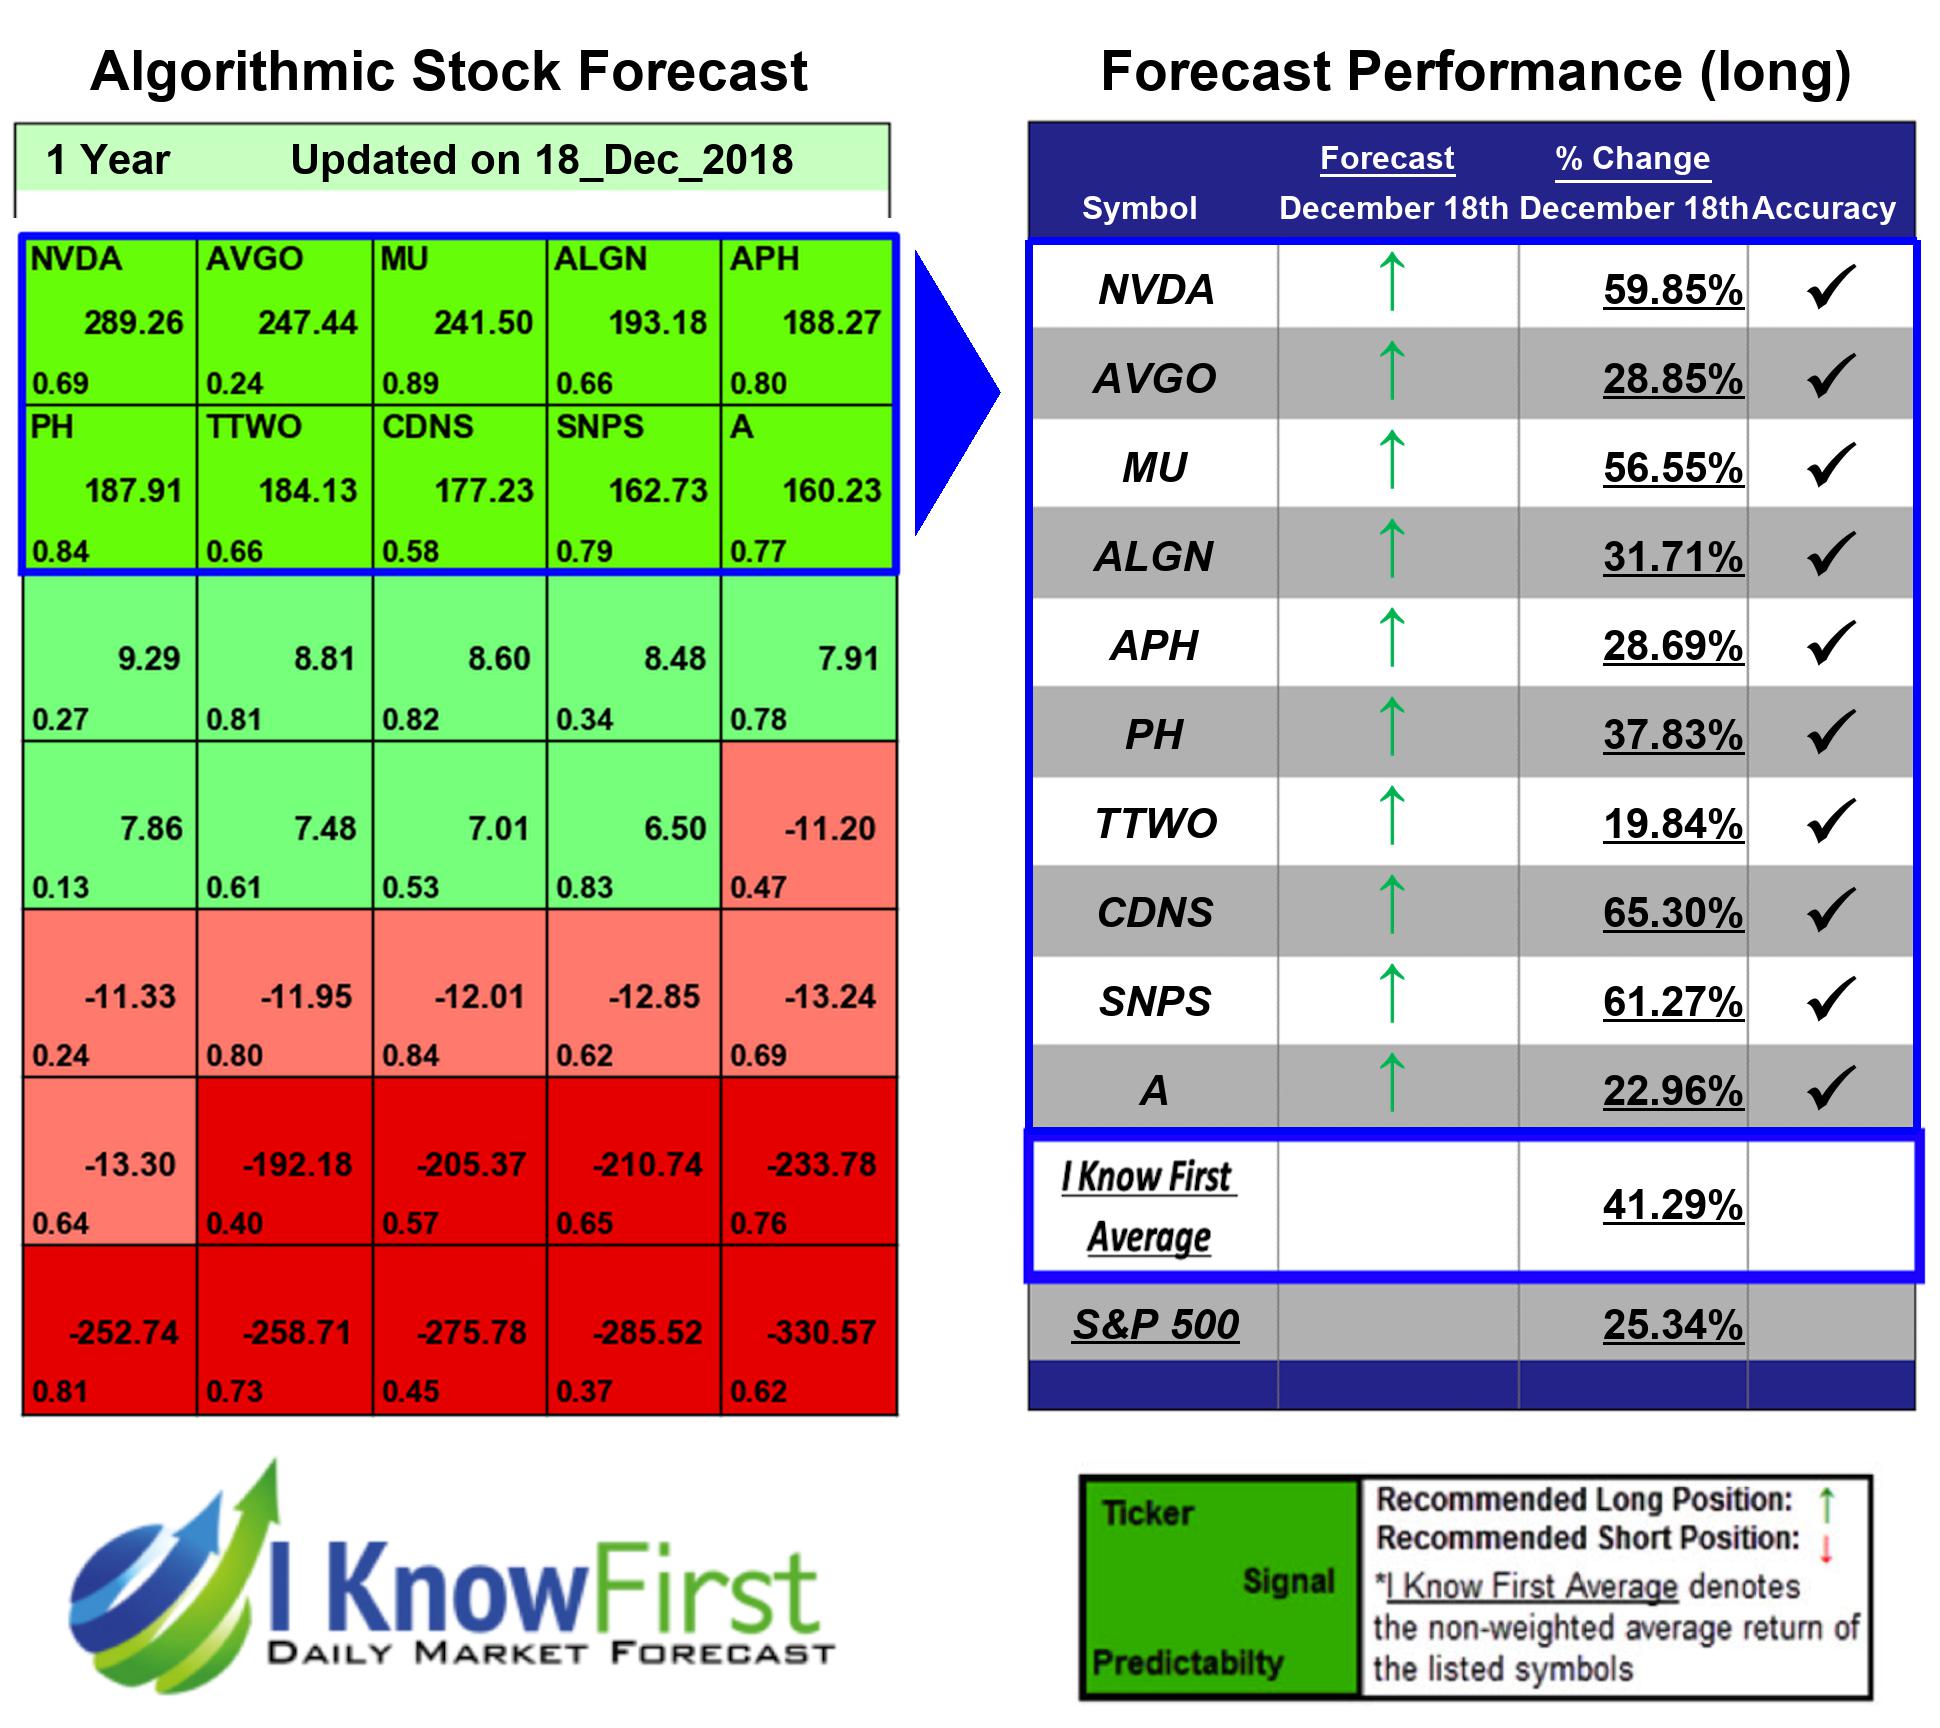
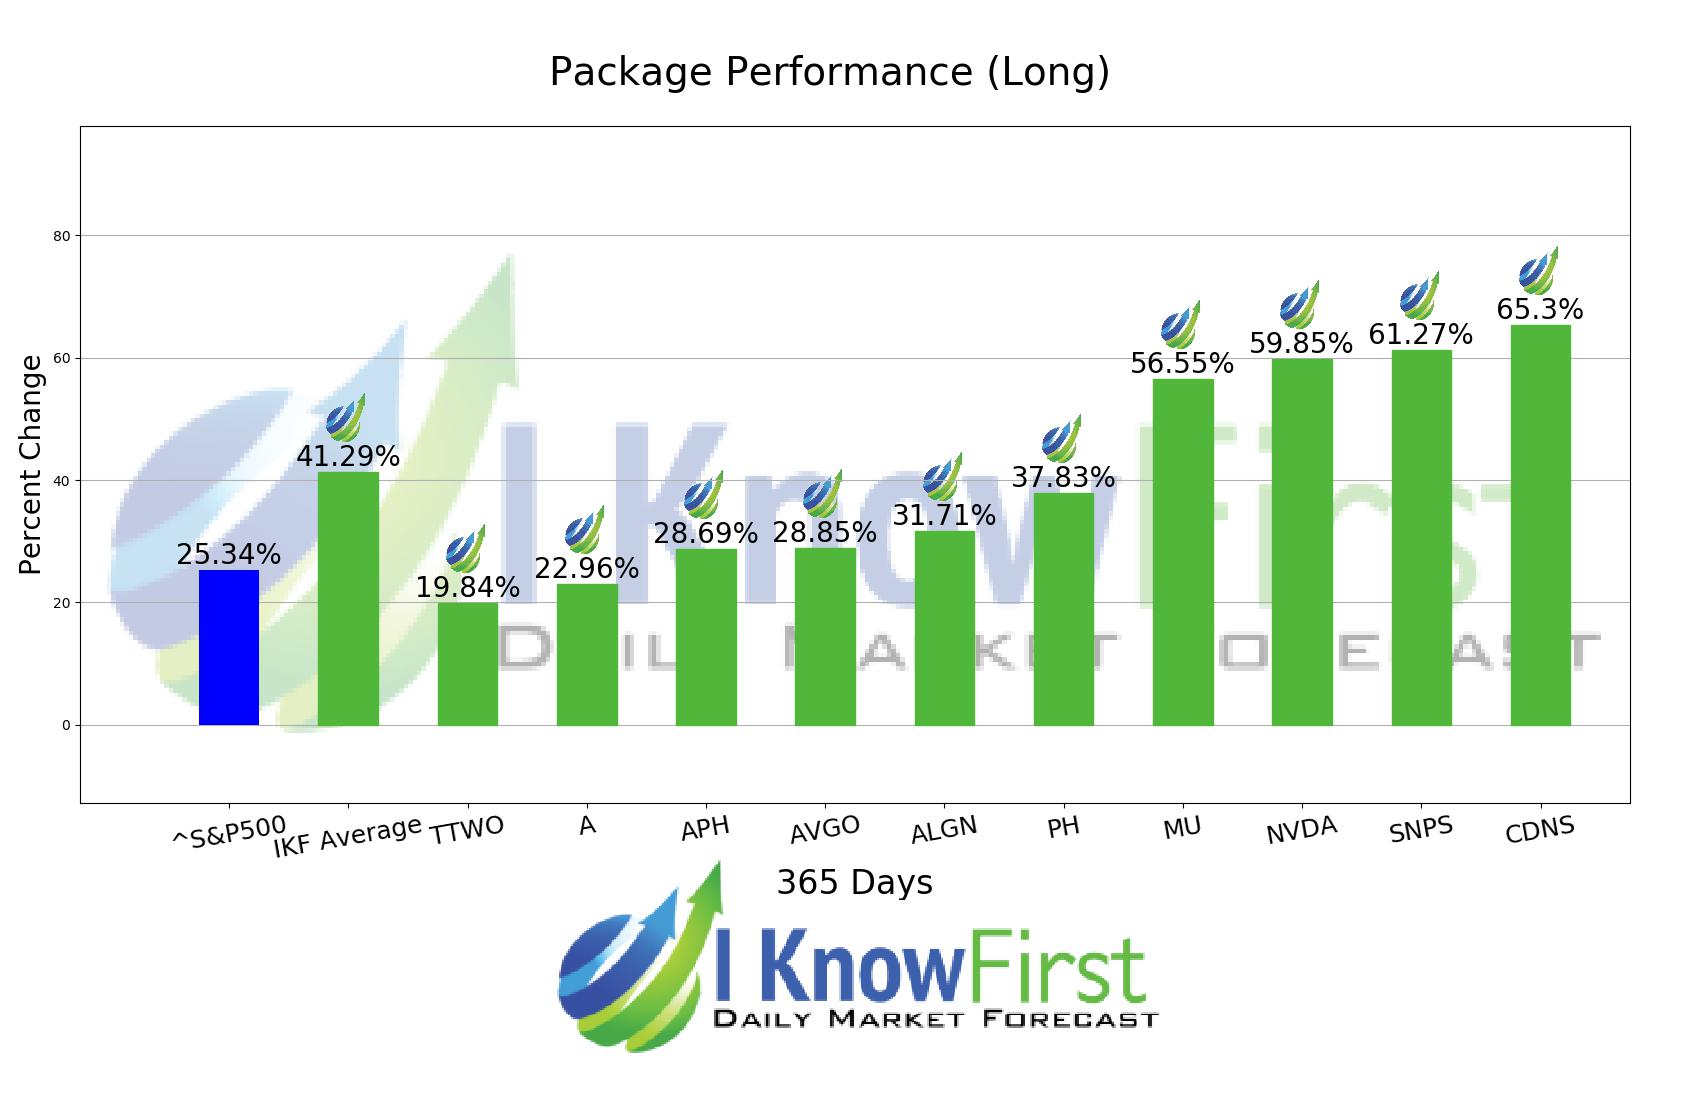
During the 1 Year forecasted period several picks in the S&P500 Companies Package saw significant returns. The algorithm had correctly predicted 10 out 10 returns. The greatest return came from CDNS at 65.3%. Further notable returns came from SNPS and NVDA at 61.27% and 59.85%, respectively. The package had an overall average return of 41.29%, providing investors with a 15.95% premium over the S&P 500’s return of 25.34% during the period.
Cadence Design Systems, Inc. provides electronic design automation software, emulation and prototyping hardware, system interconnect, and analysis worldwide. It offers functional verification, including emulation and prototyping hardware. Additionally, it offers services related to methodology, education, and hosted design solutions, as well as technical support and maintenance services. The company was founded in 1988 and is headquartered in San Jose, California.
Algorithmic traders utilize these daily forecasts by the I Know First market prediction system as a tool to enhance portfolio performance, verify their own analysis and act on market opportunities faster. This forecast was sent to current I Know First subscribers.
How to interpret this diagram
Algorithmic Stock Forecast: The table on the left is a stock forecast produced by I Know First’s algorithm. Each day, subscribers receive forecasts for six different time horizons. Note that the top 10 stocks in the 1-month forecast may be different than those in the 1-year forecast. In the included table, only the relevant stocks have been included. The boxes are arranged according to their respective signal and predictability values (see below for detailed definitions). A green box represents a positive forecast, suggesting a long position, while a red represents a negative forecast, suggesting a short position.
Please note-for trading decisions use the most recent forecast. Get today’s forecast and Top stock picks.


