
Best Stocks To Buy Based on Deep-Learning: Returns up to 4.8% in 3 Days
Best Stocks To Buy
This top S&P 500 stocks forecast is designed for investors and analysts who need predictions for the whole S&P 500 (See S&P 500 Companies Package). It includes 20 stocks with bullish and bearish signals and indicates the best S&P 500 Companies stocks to buy:
- Top 10 S&P 500 stocks for the long position
- Top 10 S&P 500 stocks for the short position

Package Name: Top S&P 500 Stocks
Recommended Positions: Long
Forecast Length: 3 Days (8/8/21 – 8/12/21)
I Know First Average: 2.03%
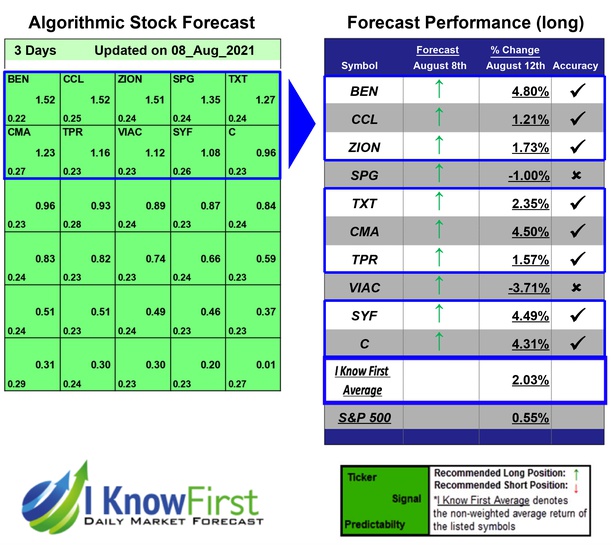
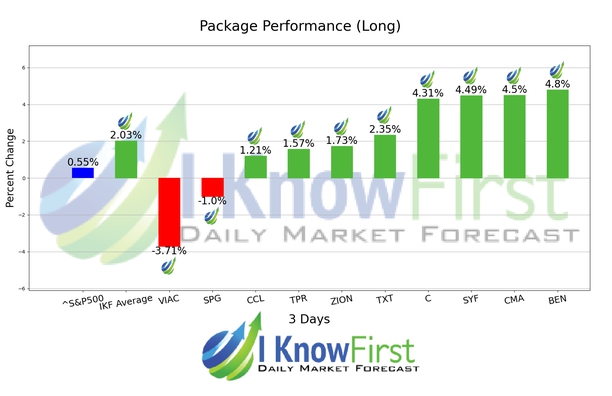
Several predictions in this 3 Days forecast saw significant returns. The algorithm had correctly predicted 8 out of 10 stock movements. The top performing prediction from this package was BEN with a return of 4.8%. The suggested trades for CMA and SYF also had notable 3 Days yields of 4.5% and 4.49%, respectively. This algorithmic forecast package presented an overall return of 2.03% versus the S&P 500’s performance of 0.55% providing a market premium of 1.48%.
Franklin Resources, Inc. (BEN) is a publicly owned asset management holding company. Through its subsidiaries, the firm provides its services to individuals, institutions, pension plans, trusts, and partnerships. It launches equity, fixed income, balanced, and multi-asset mutual funds through its subsidiaries. The firm invests in public equity, fixed income, and alternative markets. Franklin Resources, Inc. (BEN) was founded in 1947 and is based in San Mateo, California with an additional office in Hyderabad, India.
Algorithmic traders utilize these daily forecasts by the I Know First market prediction system as a tool to enhance portfolio performance, verify their own analysis and act on market opportunities faster. This forecast was sent to current I Know First subscribers.
How to interpret this diagram
Algorithmic Stock Forecast: The table on the left is a stock forecast produced by I Know First’s algorithm. Each day, subscribers receive forecasts for six different time horizons. Note that the top 10 stocks in the 1-month forecast may be different than those in the 1-year forecast. In the included table, only the relevant stocks have been included. The boxes are arranged according to their respective signal and predictability values (see below for detailed definitions). A green box represents a positive forecast, suggesting a long position, while a red represents a negative forecast, suggesting a short position.
Please note-for trading decisions use the most recent forecast. Get today’s forecast and Top stock picks.


