
Best Stocks To Buy Based on Deep-Learning: Returns up to 162.67% in 3 Months
Best Stocks To Buy
This top S&P 500 stocks forecast is designed for investors and analysts who need predictions for the whole S&P 500 (See S&P 500 Companies Package). It includes 20 stocks with bullish and bearish signals and indicates the best S&P 500 Companies stocks to buy:
- Top 10 S&P 500 stocks for the long position
- Top 10 S&P 500 stocks for the short position

Package Name: Top S&P 500 Stocks
Recommended Positions: Long
Forecast Length: 3 Months (10/27/20 – 1/27/21)
I Know First Average: 31.78%
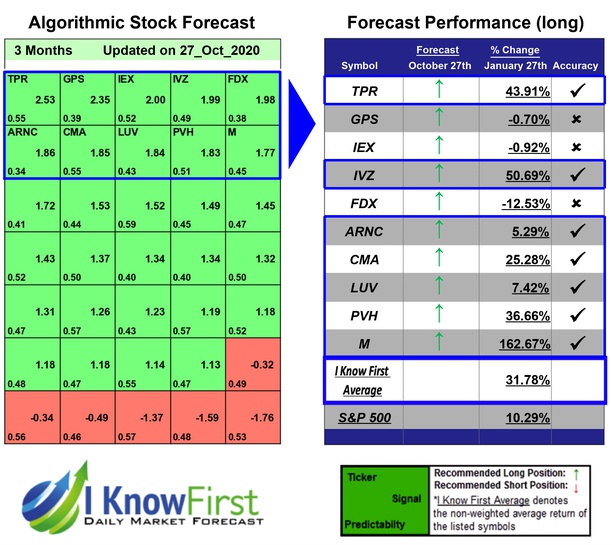
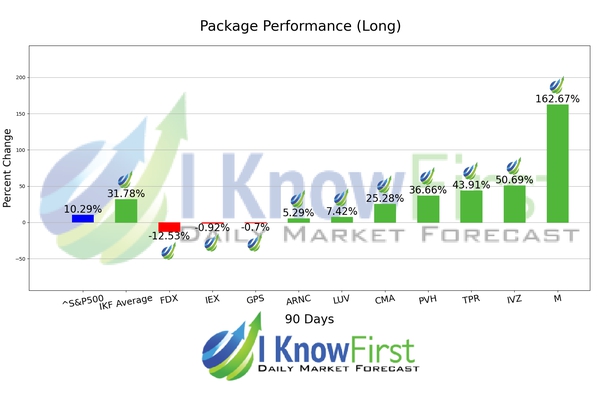
Several predictions in this 3 Months forecast saw significant returns. The algorithm had correctly predicted 7 out 10 stock movements. M was our best stock pick this week a return of 162.67%. IVZ and TPR followed with returns of 50.69% and 43.91% for the 3 Months period. The Top S&P 500 Stocks package had an overall average return of 31.78%, providing investors with a premium of 21.49% over the S&P 500’s return of 10.29%.
Macy’s, Inc., together with its subsidiaries, operates stores, Websites, and mobile applications in the United States. Its stores and Websites sell a range of merchandise, including apparel and accessories for men, women, and children; cosmetics; home furnishings; and other consumer goods. The company also operates stores that offer a range of women’s, men’s, and children’s apparel; shoes; fashion accessories; housewares; home textiles; intimate apparel; and jewelry. As of November 1, 2016, it operated approximately 880 stores in 45 states, the District of Columbia, Guam, and Puerto Rico under the Macy’s, Bloomingdale’s, Bloomingdale’s Outlet, Macy’s Backstage, and Bluemercury names, as well as Websites, including macys.com, bloomingdales.com, and bluemercury.com. In addition, it operates as a beauty products and spa retailer. The company was formerly known as Federated Department Stores, Inc. and changed its name to Macy’s, Inc. in June 2007. Macy’s, Inc. was founded in 1830 and is based in Cincinnati, Ohio.
Algorithmic traders utilize these daily forecasts by the I Know First market prediction system as a tool to enhance portfolio performance, verify their own analysis and act on market opportunities faster. This forecast was sent to current I Know First subscribers.
How to interpret this diagram
Algorithmic Stock Forecast: The table on the left is a stock forecast produced by I Know First’s algorithm. Each day, subscribers receive forecasts for six different time horizons. Note that the top 10 stocks in the 1-month forecast may be different than those in the 1-year forecast. In the included table, only the relevant stocks have been included. The boxes are arranged according to their respective signal and predictability values (see below for detailed definitions). A green box represents a positive forecast, suggesting a long position, while a red represents a negative forecast, suggesting a short position.
Please note-for trading decisions use the most recent forecast. Get today’s forecast and Top stock picks.


