
Best S&P 500 Stock Picks Based on Algorithmic Trading: Returns up to 24.86% in 1 Month
Best S&P 500 Stock Picks
This top S&P 500 stocks forecast is designed for investors and analysts who need predictions for the whole S&P 500 (See S&P 500 Companies Package). It includes 20 stock picks with bullish and bearish signals and indicates the best S&P 500 Companies stocks to buy:
- Top 10 S&P 500 stocks for the long position
- Top 10 S&P 500 stocks for the short position

Package Name: Top S&P 500 Stocks
Recommended Positions: Long
Forecast Length: 1 Month (11/24/2019 – 12/25/2019)
I Know First Average: 7.68%
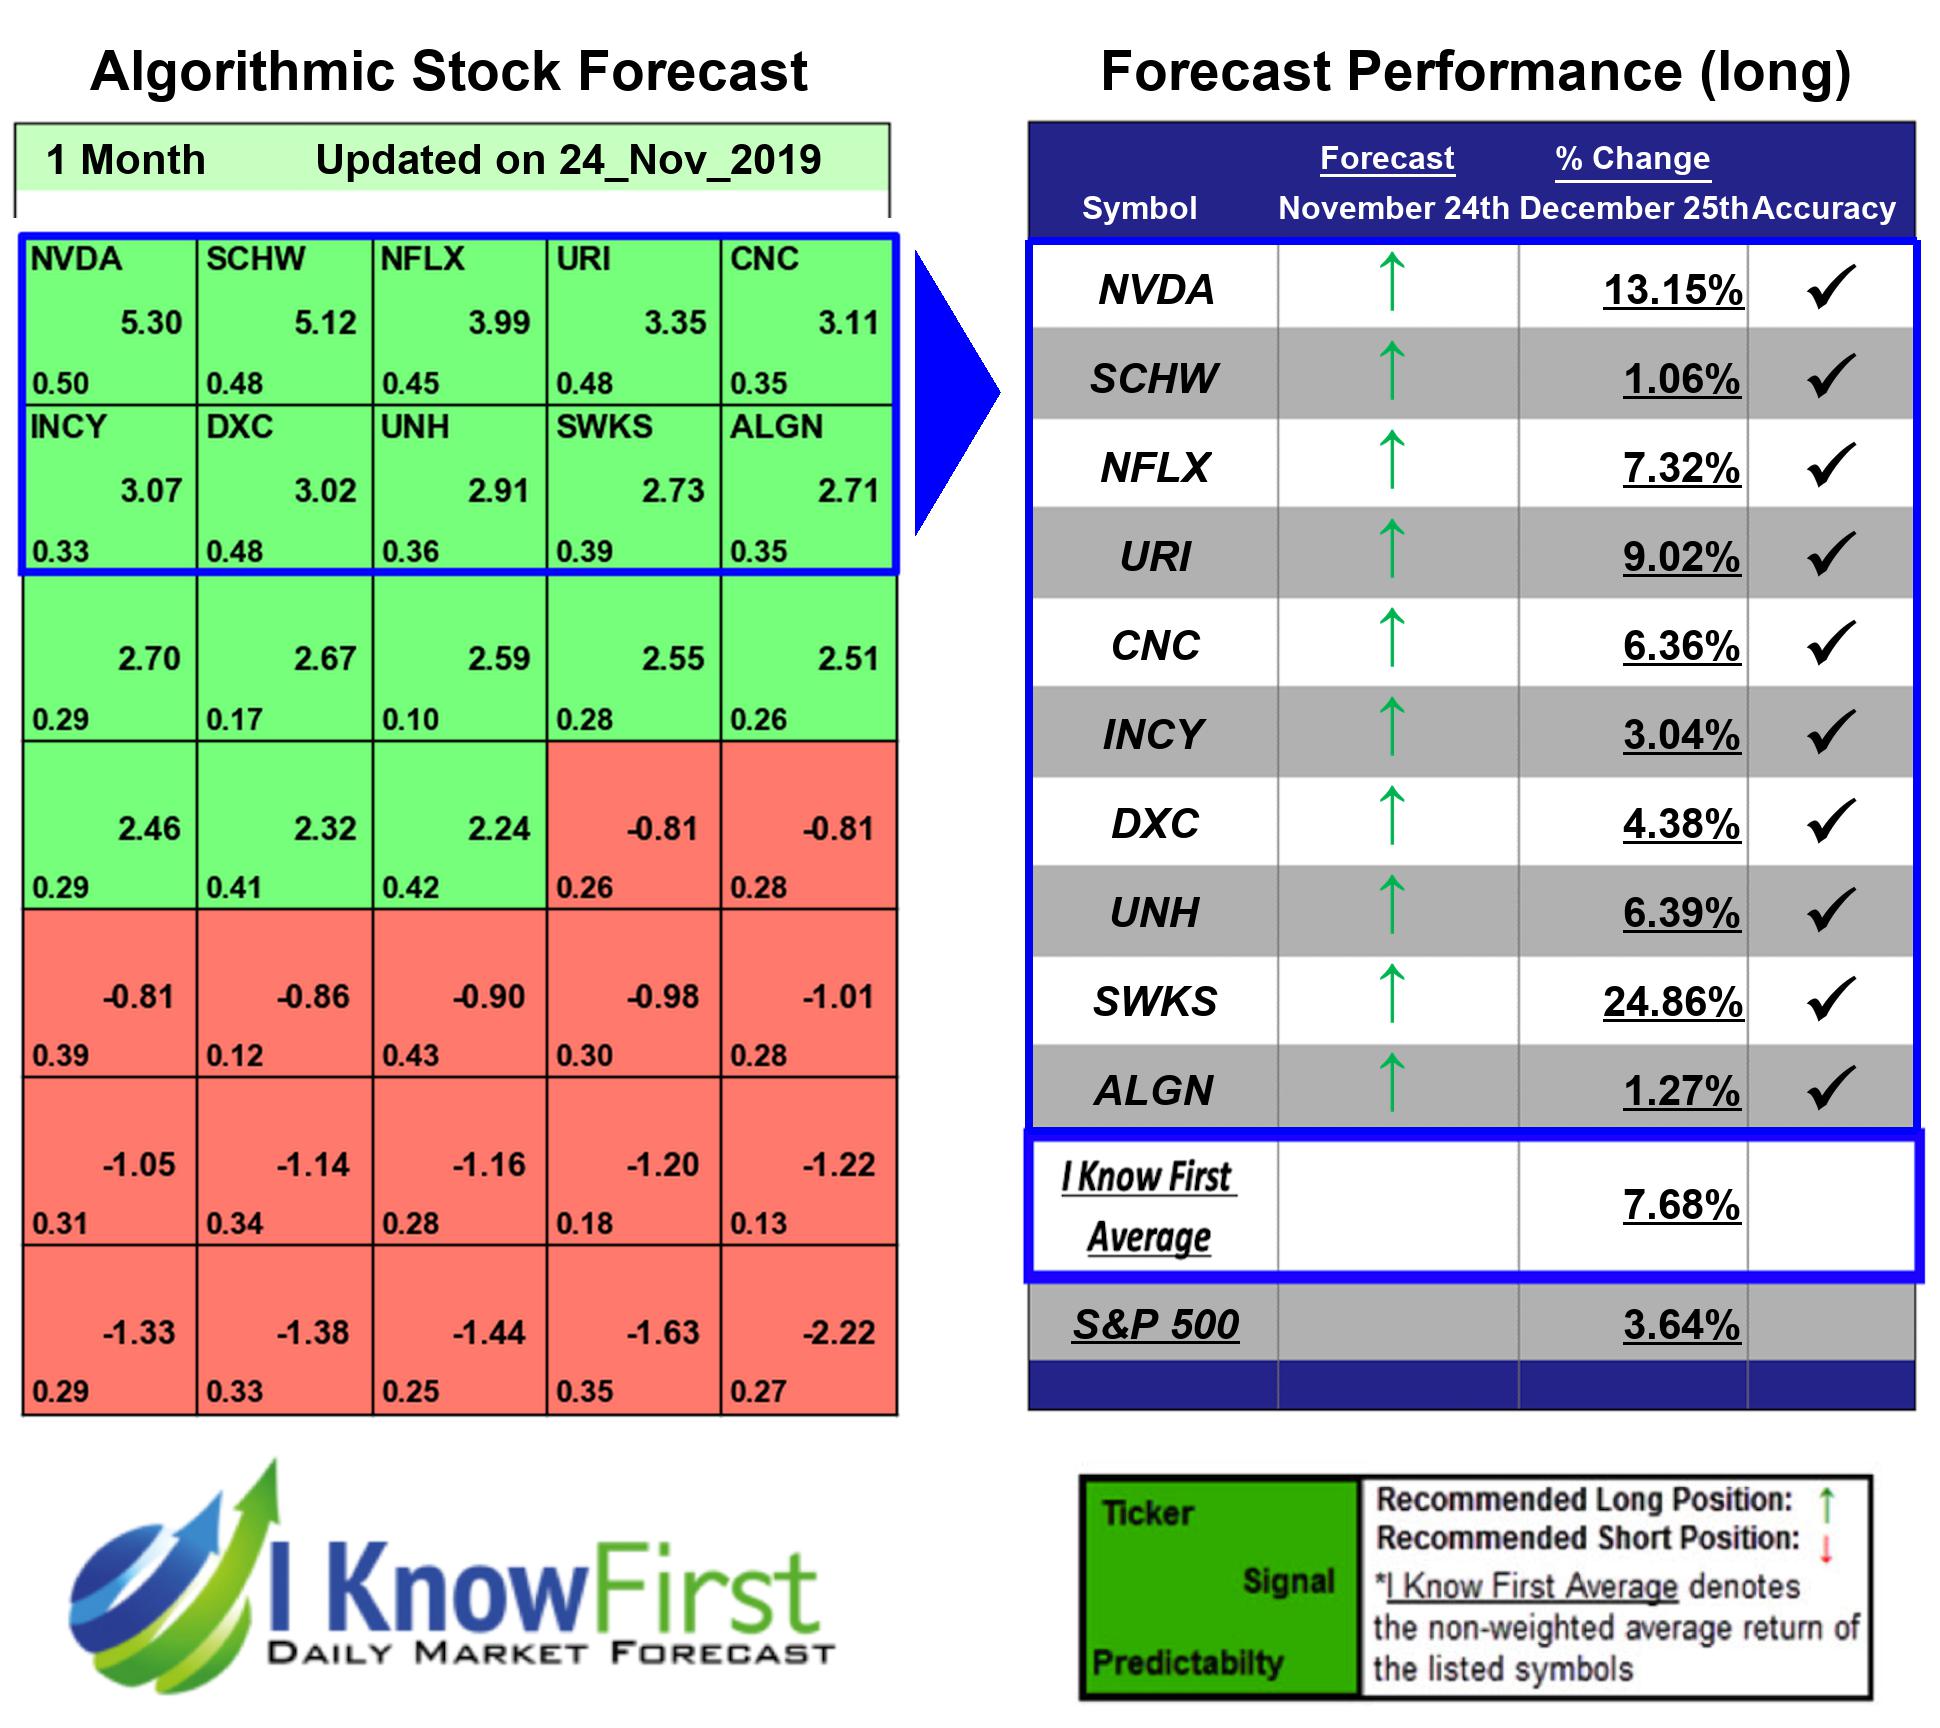
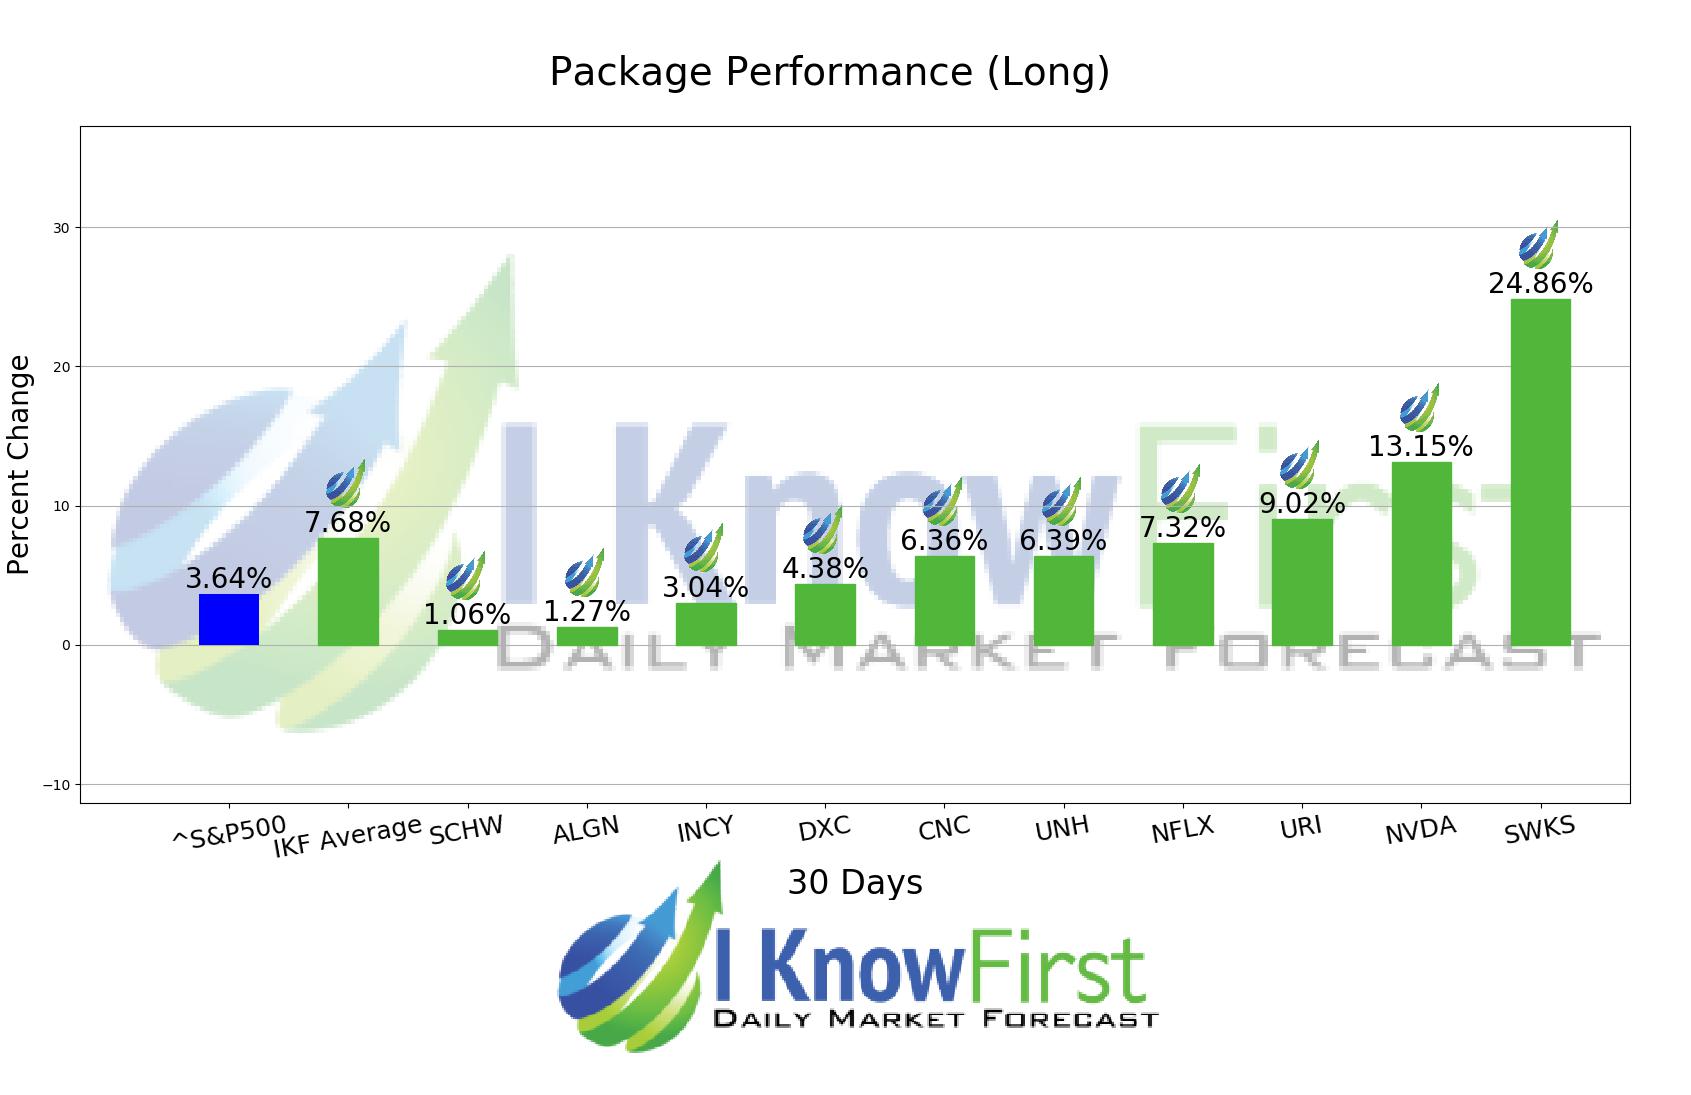
10 out of 10 stock prices in this forecast for the Top S&P 500 Stocks Package moved as predicted by the algorithm. The top performing prediction from this package was SWKS with a return of 24.86%. The suggested trades for NVDA and URI also had notable 1 Month yields of 13.15% and 9.02%, respectively. The package saw an overall yield of 7.68% versus the S&P 500’s return of 3.64% implying a market premium of 4.04%.
Skyworks Solutions, Inc. (SWKS), together with its subsidiaries, designs, develops, manufactures, and markets proprietary semiconductor products, including intellectual property worldwide.
Algorithmic traders utilize these daily forecasts by the I Know First market prediction system as a tool to enhance portfolio performance, verify their own analysis and act on market opportunities faster. This forecast was sent to current I Know First subscribers.
How to interpret this diagram
Algorithmic Stock Forecast: The table on the left is a stock forecast produced by I Know First’s algorithm. Each day, subscribers receive forecasts for six different time horizons. Note that the top 10 stocks in the 1-month forecast may be different than those in the 1-year forecast. In the included table, only the relevant stocks have been included. The boxes are arranged according to their respective signal and predictability values (see below for detailed definitions). A green box represents a positive forecast, suggesting a long position, while a red represents a negative forecast, suggesting a short position.
Please note-for trading decisions use the most recent forecast. Get today’s forecast and Top stock picks.


