
Best Small Cap Tech Stocks Based on Stock Prediction Algorithm: Returns up to 28.46% in 14 Days
Best Small Cap Tech Stocks
This Small Cap Tech Stock forecast is based on stock picking strategies for investors and analysts who need predictions for the 10 best emerging stocks in the Technology Industry. It includes 20 stocks with bullish and bearish signals:
- Top 10 Small Cap Tech stocks for the long position
- Top 10 Small Cap Tech stocks for the short position

Package Name: Small Cap Tech Stocks Forecast
Recommended Positions: Long
Forecast Length: 14 Days (1/10/21 – 1/25/21)
I Know First Average: 7.86%
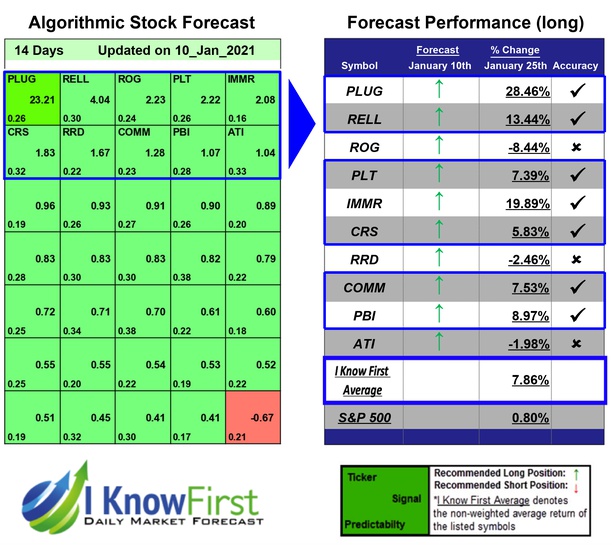
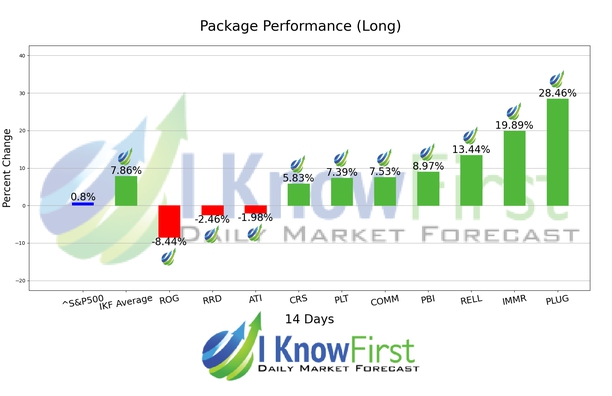
I Know First’s State of the Art Algorithm accurately forecasted 7 out of 10 trades in this Small Cap Tech Stocks Forecast Package for the 14 Days time period. The top-performing prediction in this forecast was PLUG, which registered a return of 28.46%. IMMR and RELL saw outstanding returns of 19.89% and 13.44%. This algorithmic forecast package presented an overall return of 7.86% versus S&P 500’s performance of 0.8% providing a market premium of 7.06%.
Plug Power Inc., an alternative energy technology provider, engages in the design, development, commercialization, and manufacture of hydrogen fuel cell systems primarily for the material handling and stationary power markets in the United States. Plug Power Inc. was founded in 1997 and is headquartered in Latham, New York.
Algorithmic traders utilize these daily forecasts by the I Know First market prediction system as a tool to enhance portfolio performance, verify their own analysis and act on market opportunities faster. This forecast was sent to current I Know First subscribers.
How to interpret this diagram
Algorithmic Stock Forecast: The table on the left is a stock forecast produced by I Know First’s algorithm. Each day, subscribers receive forecasts for six different time horizons. Note that the top 10 stocks in the 1-month forecast may be different than those in the 1-year forecast. In the included table, only the relevant stocks have been included. The boxes are arranged according to their respective signal and predictability values (see below for detailed definitions). A green box represents a positive forecast, suggesting a long position, while a red represents a negative forecast, suggesting a short position.
Please note-for trading decisions use the most recent forecast. Get today’s forecast and Top stock picks.


