
Best Small Cap Tech Stocks Based on Deep-Learning: Returns up to 31.0% in 1 Month
Best Small Cap Tech Stocks
This Small Cap Tech Stock forecast is based on stock picking strategies for investors and analysts who need predictions for the 10 best emerging stocks in the Technology Industry. It includes 20 stocks with bullish and bearish signals:
- Top 10 Small Cap Tech stocks for the long position
- Top 10 Small Cap Tech stocks for the short position
Package Name: Small Cap Tech Stocks Forecast
Recommended Positions: Long
Forecast Length: 1 Month (11/27/20 – 12/28/20)
I Know First Average: 10.9%
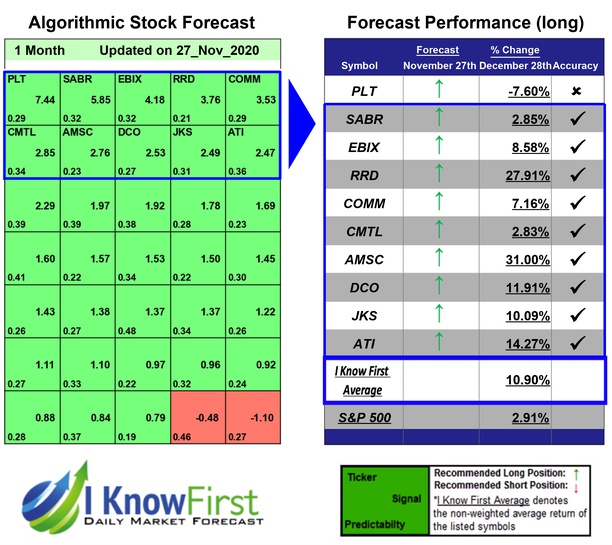

In this 1 Month forecast for the Small Cap Tech Stock Forecast Package, there were many high performing trades and the algorithm correctly predicted 9 out 10 trades. AMSC was our best stock pick this week a return of 31.0%. Additional high returns came from RRD and ATI, at 27.91% and 14.27% respectively. With these notable trade returns, the package itself registered an average return of 10.9% compared to the S&P 500’s return of 2.91% for the same period.
American Superconductor Corporation (AMSC) provides megawatt-scale solutions worldwide. The company operates through two segments, Wind and Grid.
Algorithmic traders utilize these daily forecasts by the I Know First market prediction system as a tool to enhance portfolio performance, verify their own analysis and act on market opportunities faster. This forecast was sent to current I Know First subscribers.
How to interpret this diagram
Algorithmic Stock Forecast: The table on the left is a stock forecast produced by I Know First’s algorithm. Each day, subscribers receive forecasts for six different time horizons. Note that the top 10 stocks in the 1-month forecast may be different than those in the 1-year forecast. In the included table, only the relevant stocks have been included. The boxes are arranged according to their respective signal and predictability values (see below for detailed definitions). A green box represents a positive forecast, suggesting a long position, while a red represents a negative forecast, suggesting a short position.
Please note-for trading decisions use the most recent forecast. Get today’s forecast and Top stock picks.


