
Best Robinhood Stocks Based on Pattern Recognition: Returns up to 13.34% in 7 Days
Best Robinhood Stocks
This forecast is part of the Robinhood Trades Package, one of I Know First’s algorithmic trading tools. The full investment universe includes the most traded stocks by Robinhood stock trading platform users. Based on it, I Know First AI Algorithm identifies the most promising stocks and produces forecasts that include:
- Top 10 stocks from Robinhood Trades for the long position
- Top 10 stocks from Robinhood Trades for the short position

Package Name: Robinhood Trades
Recommended Positions: Long
Forecast Length: 7 Days (12/19/21 – 12/27/21)
I Know First Average: 5.88%

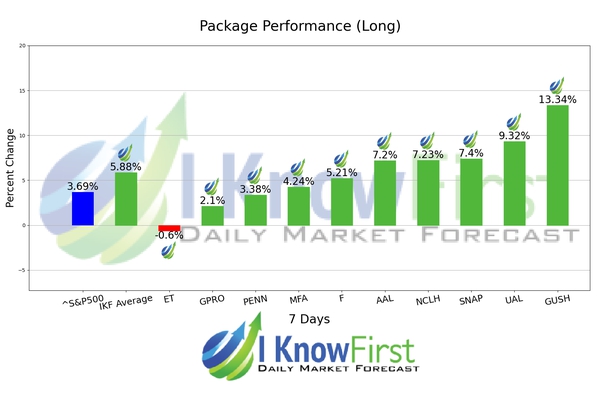
During the 7 Days forecasted period several picks in the Robinhood Trades Package saw significant returns. The algorithm had correctly predicted 9 out of 10 returns. The greatest return came from GUSH at 13.34%. UAL and SNAP also performed well for this time horizon with returns of 9.32% and 7.4%, respectively. The package itself saw an overall return of 5.88%, providing investors with a 2.19% premium above the S&P 500’s return of 3.69% for the same time period.
Algorithmic traders utilize these daily forecasts by the I Know First market prediction system as a tool to enhance portfolio performance, verify their own analysis and act on market opportunities faster. This forecast was sent to current I Know First subscribers.
How to interpret this diagram
Algorithmic Stock Forecast: The table on the left is a stock forecast produced by I Know First’s algorithm. Each day, subscribers receive forecasts for six different time horizons. Note that the top 10 stocks in the 1-month forecast may be different than those in the 1-year forecast. In the included table, only the relevant stocks have been included. The boxes are arranged according to their respective signal and predictability values (see below for detailed definitions). A green box represents a positive forecast, suggesting a long position, while a red represents a negative forecast, suggesting a short position.
Please note-for trading decisions use the most recent forecast. Get today’s forecast and Top stock picks.


