
Best Mid Cap Stocks Based on Pattern Recognition: Returns up to 29.46% in 1 Month
Best Mid Cap Stocks
This Best Mid Cap Stocks forecast is designed for investors and analysts who need predictions for the best companies with market capitalization between USD 500m and USD 50b. It includes 20 stocks with bullish and bearish signals:
- Top 10 Mid Cap stocks for the long position
- Top 10 Mid Cap stocks for the short position
Package Name: Best Mid Cap Stocks
Recommended Positions: Long
Forecast Length: 1 Month (4/25/21 – 5/25/21)
I Know First Average: 1.23%
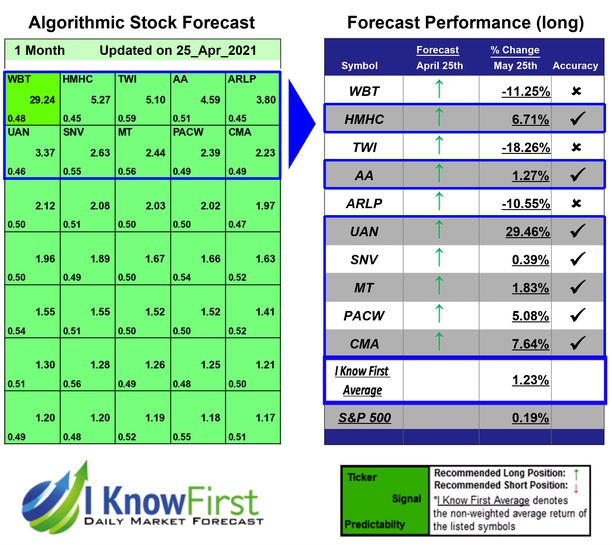

In this 1 Month forecast for the Best Mid Cap Stocks Package, there were many high performing trades and the algorithm correctly predicted 7 out 10 trades. The top-performing prediction in this forecast was UAN, which registered a return of 29.46%. CMA, and HMHC had notable returns of 7.64% and 6.71%. The overall average return in this Best Mid Cap Stocks package was 1.23%, providing investors with a 1.04% premium over the S&P 500’s return of 0.19% during the same period.
CVR Partners, LP (UAN) produces, distributes, and markets nitrogen fertilizer products in North America. It provides ammonia products for industrial and agricultural customers; and urea ammonium nitrate products for agricultural customers. CVR GP, LLC serves as the general partner of the company. The company was founded in 2007 and is headquartered in Sugar Land, Texas. CVR Partners, LP (UAN) operates as a subsidiary of Coffeyville Resources LLC.
Algorithmic traders utilize these daily forecasts by the I Know First market prediction system as a tool to enhance portfolio performance, verify their own analysis and act on market opportunities faster. This forecast was sent to current I Know First subscribers.
How to interpret this diagram
Algorithmic Stock Forecast: The table on the left is a stock forecast produced by I Know First’s algorithm. Each day, subscribers receive forecasts for six different time horizons. Note that the top 10 stocks in the 1-month forecast may be different than those in the 1-year forecast. In the included table, only the relevant stocks have been included. The boxes are arranged according to their respective signal and predictability values (see below for detailed definitions). A green box represents a positive forecast, suggesting a long position, while a red represents a negative forecast, suggesting a short position.
Please note-for trading decisions use the most recent forecast. Get today’s forecast and Top stock picks.


