
Best Mid Cap Stocks Based on Big Data Analytics: Returns up to 31.55% in 3 Days
Best Mid Cap Stocks
This Best Mid Cap Stocks forecast is designed for investors and analysts who need predictions for the best companies with market capitalization between USD 500m and USD 50b. It includes 20 stocks with bullish and bearish signals:
- Top 10 Mid Cap stocks for the long position
- Top 10 Mid Cap stocks for the short position
Package Name: Best Mid Cap Stocks
Recommended Positions: Long
Forecast Length: 3 Days (10/31/21 – 11/4/21)
I Know First Average: 8.43%
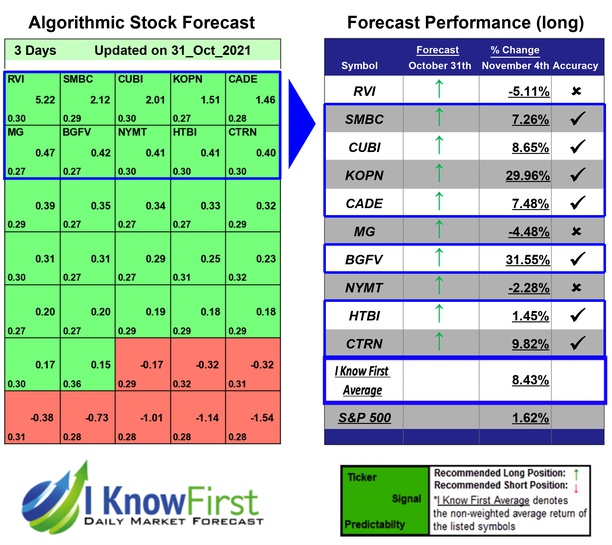
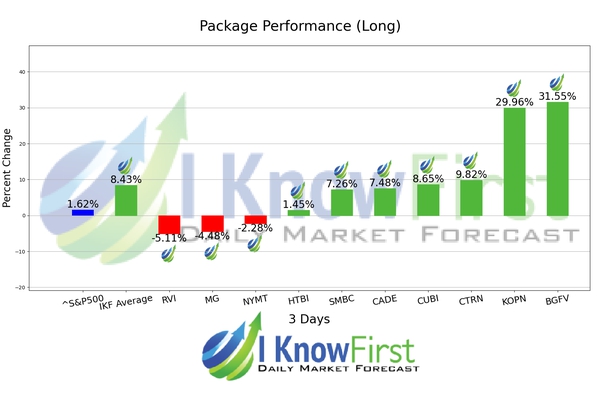
This Best Mid Cap Stocks Package forecast had correctly predicted 7 out of 10 stock movements. The highest trade return came from BGFV, at 31.55%. KOPN, and CTRN had notable returns of 29.96% and 9.82%. The package’s overall average return was 8.43%, providing investors with a 6.81% premium over the S&P 500’s return of 1.62% during the same period.
Big 5 Sporting Goods Corporation, incorporated on October 31, 1997, is a sporting goods retailer in the western United States. The Company offers a range of products in a sporting goods store format. The Company also offers products online through its e-commerce platform. The Company’s product mix includes athletic shoes, apparel and accessories, as well as a range of outdoor and athletic equipment for team sports, fitness, camping, hunting, fishing, tennis, golf, winter and summer recreation, and roller sports. The Company purchases merchandise from sporting goods equipment, athletic footwear and apparel manufacturers. It offers various brands, such as Adidas, Coleman, Footjoy, JanSport, Rawlings, Spalding, Asics, Columbia, Franklin, Lifetime, Razor, Speedo, Bearpaw, Crocs, Gildan, Mizuno, Rollerblade and Timex.
Algorithmic traders utilize these daily forecasts by the I Know First market prediction system as a tool to enhance portfolio performance, verify their own analysis and act on market opportunities faster. This forecast was sent to current I Know First subscribers.
How to interpret this diagram
Algorithmic Stock Forecast: The table on the left is a stock forecast produced by I Know First’s algorithm. Each day, subscribers receive forecasts for six different time horizons. Note that the top 10 stocks in the 1-month forecast may be different than those in the 1-year forecast. In the included table, only the relevant stocks have been included. The boxes are arranged according to their respective signal and predictability values (see below for detailed definitions). A green box represents a positive forecast, suggesting a long position, while a red represents a negative forecast, suggesting a short position.
Please note-for trading decisions use the most recent forecast. Get today’s forecast and Top stock picks.


