
Best High Short Interest Stocks Based on Stock Algorithm: Returns up to 49.52% in 3 Days
Best High Short Interest Stocks
The High Short Interest Stocks Package is designed for investors and analysts who need predictions for stocks with high short interest that are often very volatile and well known for making explosive upside moves (known as a short squeeze). Such stocks have prices that can potentially move up very quickly as traders with open short positions move to cover. It includes 20 stocks with bullish and bearish signals and indicates the best stocks to buy and sell:
- Top 10 High Short Interest Stocks for the long position
- Top 10 High Short Interest Stocks for the short position
Package Name: High Short Interest Stocks
Recommended Positions: Long
Forecast Length: 3 Days (10/29/21 – 11/2/21)
I Know First Average: 10.9%
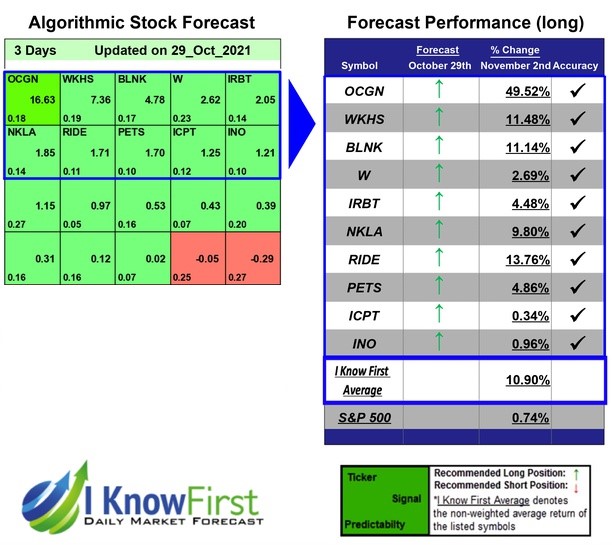

In this 3 Days forecast for the High Short Interest Stocks Package, there were many high performing trades and the algorithm correctly predicted 10 out of 10 trades. OCGN was the top performing prediction with a return of 49.52%. The suggested trades for RIDE and WKHS also had notable 3 Days yields of 13.76% and 11.48%, respectively. This algorithmic forecast package presented an overall return of 10.9% versus the S&P 500’s performance of 0.74% providing a market premium of 10.16%.
Algorithmic traders utilize these daily forecasts by the I Know First market prediction system as a tool to enhance portfolio performance, verify their own analysis and act on market opportunities faster. This forecast was sent to current I Know First subscribers.
How to interpret this diagram
Algorithmic Stock Forecast: The table on the left is a stock forecast produced by I Know First’s algorithm. Each day, subscribers receive forecasts for six different time horizons. Note that the top 10 stocks in the 1-month forecast may be different than those in the 1-year forecast. In the included table, only the relevant stocks have been included. The boxes are arranged according to their respective signal and predictability values (see below for detailed definitions). A green box represents a positive forecast, suggesting a long position, while a red represents a negative forecast, suggesting a short position.
Please note-for trading decisions use the most recent forecast. Get today’s forecast and Top stock picks.


