
Best ETF To Buy Based on Genetic Algorithms: Returns up to 106.93% in 3 Months
Best ETF To Buy
This ETF forecast is part of the ETFs Package, as one of I Know First’s quantitative investment solutions. We determine the top ETFs by screening our database daily using our advanced algorithm. The full ETFs Package advices investors on the best ETF to buy and includes a daily forecast for a total of 20 ETFs with bullish and bearish signals:
- Top 10 ETFs for the long position
- Top 10 ETFs for the short position
Package Name: ETFs Forecast
Recommended Positions: Long
Forecast Length: 3 Months (4/22/2020 – 7/22/2020)
I Know First Average: 34.19%
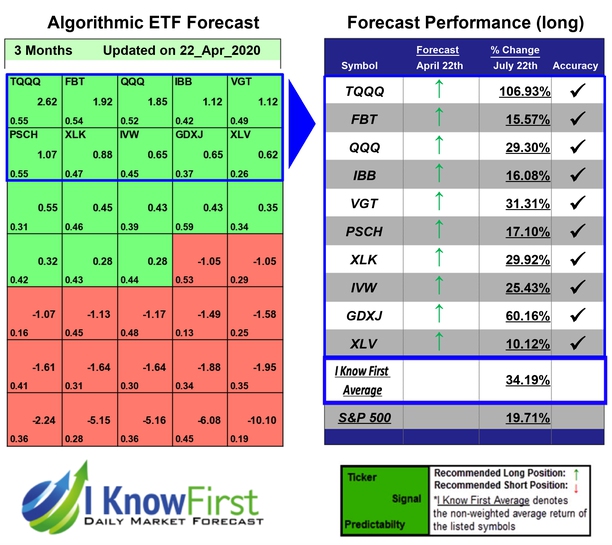
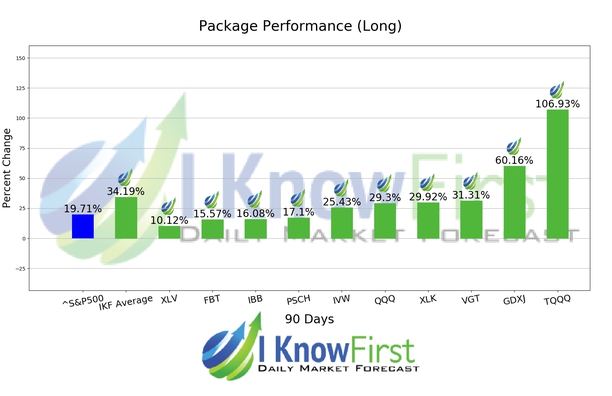
I Know First’s State of the Art Algorithm accurately forecasted 10 out of 10 trades in this ETFs Forecast Package for the 3 Months time period. TQQQ was the top performing prediction with a return of 106.93%. GDXJ and VGT also performed well for this time horizon with returns of 60.16% and 31.31%, respectively. With these notable trade returns, the package itself registered an average return of 34.19% compared to the S&P 500’s return of 19.71% for the same period.
The ProShares UltraPro QQQ provides 3x leveraged exposure to a modified market-cap-weighted index tracking 100 of the largest nonfinancial firms listed on NASDAQ.
Algorithmic traders utilize these daily forecasts by the I Know First market prediction system as a tool to enhance portfolio performance, verify their own analysis and act on market opportunities faster. This forecast was sent to current I Know First subscribers.
How to interpret this diagram
Algorithmic Stock Forecast: The table on the left is a stock forecast produced by I Know First’s algorithm. Each day, subscribers receive forecasts for six different time horizons. Note that the top 10 stocks in the 1-month forecast may be different than those in the 1-year forecast. In the included table, only the relevant stocks have been included. The boxes are arranged according to their respective signal and predictability values (see below for detailed definitions). A green box represents a positive forecast, suggesting a long position, while a red represents a negative forecast, suggesting a short position.
Please note-for trading decisions use the most recent forecast. Get today’s forecast and Top stock picks.


