
Best Energy Stocks Based on Pattern Recognition: Returns up to 26.32% in 3 Days
Best Energy Stocks
The Energy Stocks Package is based on the I Know First algorithm and is designed for investors and analysts who need recommendations for the best performing stocks for the whole Energy Industry. It includes 20 stocks with bullish and bearish signals and indicates the best stocks to buy and sell:
- Top 10 Energy stocks for the long position
- Top 10 Energy stocks for the short position

Package Name: Energy Stocks Forecast
Recommended Positions: Long
Forecast Length: 3 Days (11/6/2020 – 11/9/2020)
I Know First Average: 15.99%
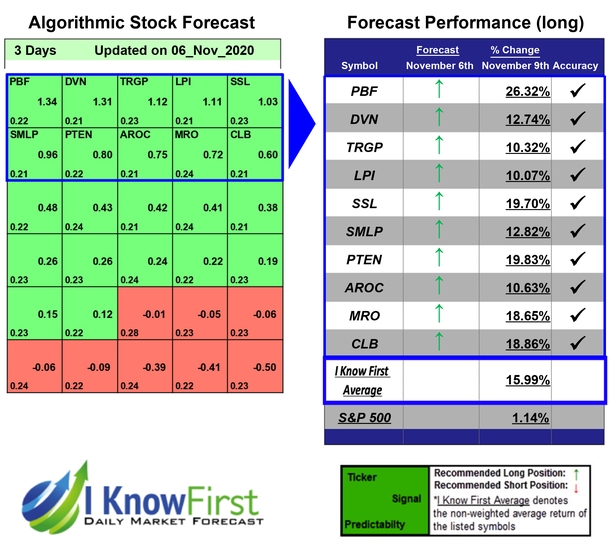

For this 3 Days forecast the algorithm had successfully predicted 10 out of 10 movements. PBF was our best stock pick this week a return of 26.32%. Further notable returns came from PTEN and SSL at 19.83% and 19.7%, respectively. This algorithmic forecast package presented an overall return of 15.99% versus S&P 500’s performance of 1.14% providing a market premium of 14.85%.
PBF Energy Inc. (PBF), together with its subsidiaries, engages in the refining and supply of petroleum products. It produces gasoline, ultra-low-sulfur diesel, heating oil, diesel fuel, jet fuel, lubricants, petrochemicals, and asphalt, as well as unbranded transportation fuels, petrochemical feedstocks, blending components, and other petroleum products. The company sells its products in Northeast and Midwest of the United States, as well as in other regions of the United States and Canada. PBF Energy Inc. (PBF) was founded in 2008 and is based in Parsippany, New Jersey.
Algorithmic traders utilize these daily forecasts by the I Know First market prediction system as a tool to enhance portfolio performance, verify their own analysis and act on market opportunities faster. This forecast was sent to current I Know First subscribers.
How to interpret this diagram
Algorithmic Stock Forecast: The table on the left is a stock forecast produced by I Know First’s algorithm. Each day, subscribers receive forecasts for six different time horizons. Note that the top 10 stocks in the 1-month forecast may be different than those in the 1-year forecast. In the included table, only the relevant stocks have been included. The boxes are arranged according to their respective signal and predictability values (see below for detailed definitions). A green box represents a positive forecast, suggesting a long position, while a red represents a negative forecast, suggesting a short position.
Please note-for trading decisions use the most recent forecast. Get today’s forecast and Top stock picks.


