
Best Brazilian Stocks Based on Data Mining: Returns up to 62.01% in 3 Months
Best Brazilian Stocks
This forecast was generated by the I Know First Algorithm through its analysis of Brazil stock market data and is part of the By Country Package. The full forecast includes daily predictions for a total of 20 best Brazilian stocks with bullish and bearish signals:
- Top 10 Brazil stocks for the long position
- Top 10 Brazil stocks for the short position
![]()
![]()
Package Name: By Country – Brazilian Stocks
Recommended Positions: Long
Forecast Length: 3 Months (1/26/21 – 4/26/21)
I Know First Average: 25.61%
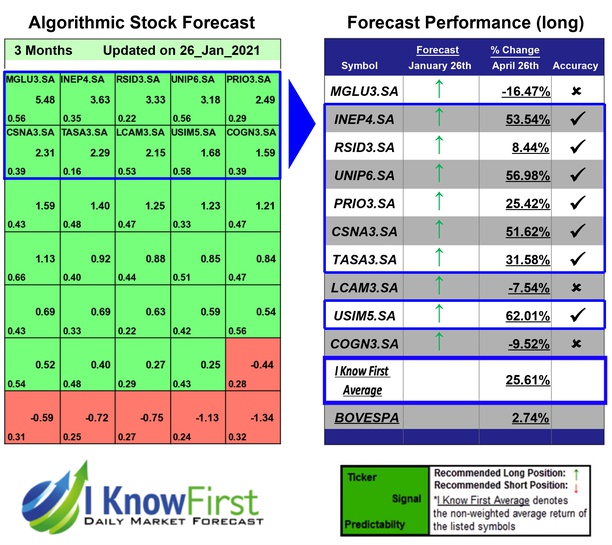
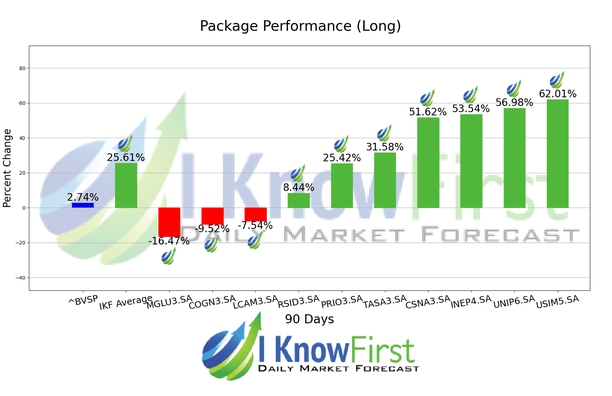
For this 3 Months forecast the algorithm had successfully predicted 7 out of 10 movements. USIM5.SA was the highest-earning trade with a return of 62.01% in 3 Months. UNIP6.SA and INEP4.SA also performed well for this time horizon with returns of 56.98% and 53.54%, respectively. The package had an overall average return of 25.61%, providing investors with a 22.87% premium over the Bovespa’s return of 2.74% during the period.
Usinas Siderúrgicas de Minas Gerais S.A. manufactures and markets flat steel products in Brazil and internationally. The company’s products include heavy plates, sincron, hot and cold rolled products, laser welded assemblies, slits/rolls, blanks, and hot-dip galvanized and electrogalvanized coils and sheets. It also provides pipes in various sizes, shapes, and thicknesses.
Algorithmic traders utilize these daily forecasts by the I Know First market prediction system as a tool to enhance portfolio performance, verify their own analysis and act on market opportunities faster. This forecast was sent to current I Know First subscribers.
How to interpret this diagram
Algorithmic Stock Forecast: The table on the left is a stock forecast produced by I Know First’s algorithm. Each day, subscribers receive forecasts for six different time horizons. Note that the top 10 stocks in the 1-month forecast may be different than those in the 1-year forecast. In the included table, only the relevant stocks have been included. The boxes are arranged according to their respective signal and predictability values (see below for detailed definitions). A green box represents a positive forecast, suggesting a long position, while a red represents a negative forecast, suggesting a short position.
Please note-for trading decisions use the most recent forecast. Get today’s forecast and Top stock picks.


