
Best Biotech Stocks Based on Big Data: Returns up to 32.52% in 3 Days
Best Biotech Stocks
The BioTech Stocks Package is designed for investors and analysts who need predictions of the best stocks to buy for the whole Biotechnology Industry. It includes 20 stocks with bullish and bearish signals and indicates the best biotech stocks to trade:
- Top 10 Biotech stocks for the long position
- Top 10 Biotech stocks for the short position

Package Name: Biotech Stocks Forecast
Recommended Positions: Long
Forecast Length: 3 Days (10/2/2020 – 10/5/2020)
I Know First Average: 5.71%
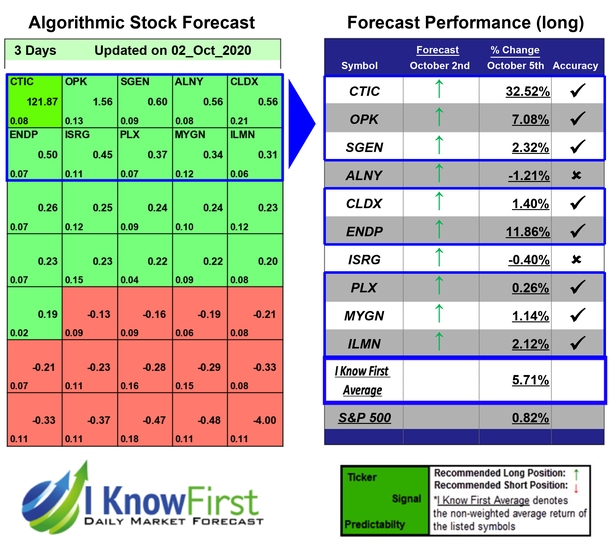
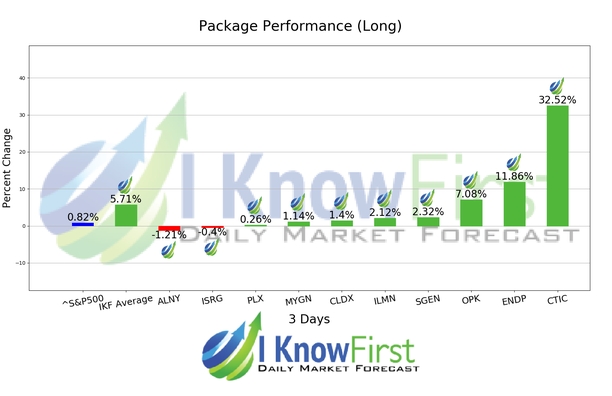
For this 3 Days forecast the algorithm had successfully predicted 8 out of 10 movements. The prediction with the highest return was CTIC, at 32.52%. ENDP and OPK saw outstanding returns of 11.86% and 7.08%. The overall average return in this Biotech Stocks Forecast package was 5.71%, providing investors with a 4.89% premium over the S&P 500’s return of 0.82% during the same period.
CTI BioPharma Corp. (CTI), incorporated on September 4, 1991, is a biopharmaceutical company focused on the acquisition, development and commercialization of targeted therapies covering a spectrum of blood-related cancers. The Company is primarily focused on commercializing PIXUVRI in select countries in the European Union, for multiply relapsed or refractory aggressive B-cell non-Hodgkin lymphoma (NHL). It is also engaged in evaluating pacritinib for the treatment of adult patients with myelofibrosis. It also evaluates its pipeline candidate paclitaxel poliglumex (Opaxio), which targets solid tumors. It is evaluating Opaxio through cooperative group sponsored trials and investigator-sponsored trials (ISTs), such as the ongoing maintenance therapy trial in patients with ovarian cancer.
Algorithmic traders utilize these daily forecasts by the I Know First market prediction system as a tool to enhance portfolio performance, verify their own analysis and act on market opportunities faster. This forecast was sent to current I Know First subscribers.
How to interpret this diagram
Algorithmic Stock Forecast: The table on the left is a stock forecast produced by I Know First’s algorithm. Each day, subscribers receive forecasts for six different time horizons. Note that the top 10 stocks in the 1-month forecast may be different than those in the 1-year forecast. In the included table, only the relevant stocks have been included. The boxes are arranged according to their respective signal and predictability values (see below for detailed definitions). A green box represents a positive forecast, suggesting a long position, while a red represents a negative forecast, suggesting a short position.
Please note-for trading decisions use the most recent forecast. Get today’s forecast and Top stock picks.


