
Best Automotive Stocks Based on Genetic Algorithms: Returns up to 11.49% in 7 Days
Best Automotive Stocks
This Automotive Stocks forecast is designed for investors and analysts who need predictions of the best-performing stocks in the automotive industry (see Automotive Stocks Package). It includes 20 stocks with bullish and bearish signals and indicates the best auto stocks to trade:
- Top 10 Automotive stocks for the long position
- Top 10 Automotive stocks for the short position
Package Name: Automotive Stock Forecast
Recommended Positions: Long
Forecast Length: 7 Days (9/22/21 – 9/29/21)
I Know First Average: 5.96%
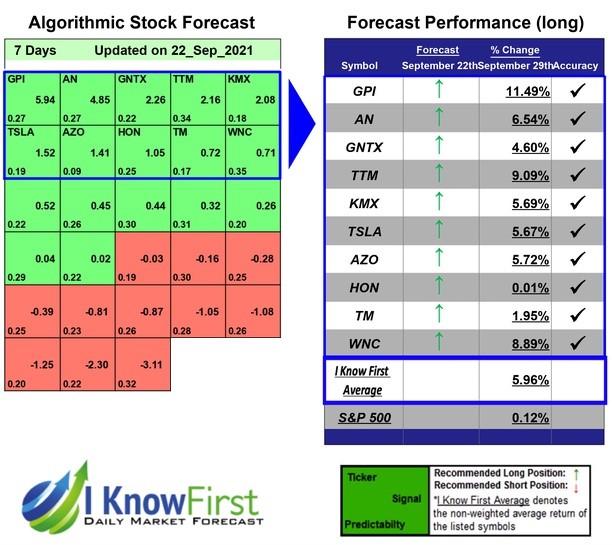
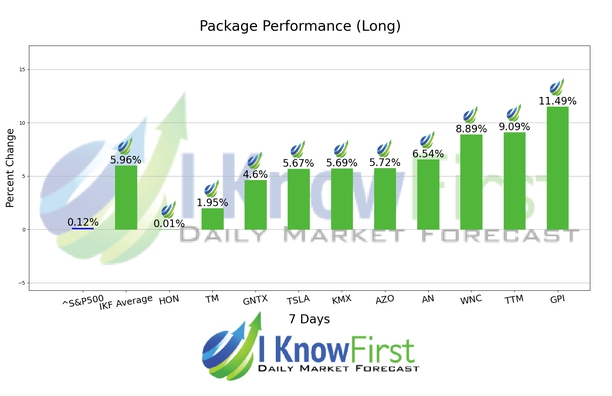
10 out of 10 stock prices in this forecast for the Automotive Stock Forecast Package moved as predicted by the algorithm. GPI was our the best stock pick with a return of 11.49%. TTM and WNC had notable returns of 9.09% and 8.89%. The package’s overall average return was 5.96%, providing investors with a 5.84% premium over the S&P 500’s return of 0.12% during the same period.
Group 1 Automotive, Inc. (GPI), through its subsidiaries, operates in the automotive retail industry. It sells new and used cars, light trucks, and vehicle parts; arranges vehicle financing; sells service and insurance contracts; and provides automotive maintenance and repair services.
Algorithmic traders utilize these daily forecasts by the I Know First market prediction system as a tool to enhance portfolio performance, verify their own analysis and act on market opportunities faster. This forecast was sent to current I Know First subscribers.
How to interpret this diagram
Algorithmic Stock Forecast: The table on the left is a stock forecast produced by I Know First’s algorithm. Each day, subscribers receive forecasts for six different time horizons. Note that the top 10 stocks in the 1-month forecast may be different than those in the 1-year forecast. In the included table, only the relevant stocks have been included. The boxes are arranged according to their respective signal and predictability values (see below for detailed definitions). A green box represents a positive forecast, suggesting a long position, while a red represents a negative forecast, suggesting a short position.
Please note-for trading decisions use the most recent forecast. Get today’s forecast and Top stock picks.


