
Best Automotive Stocks Based on Deep Learning: Returns up to 40.03% in 3 Months
Best Automotive Stocks
This Automotive Stocks forecast is designed for investors and analysts who need predictions of the best-performing stocks in the automotive industry (see Automotive Stocks Package). It includes 20 stocks with bullish and bearish signals and indicates the best auto stocks to trade:
- Top 10 Automotive stocks for the long position
- Top 10 Automotive stocks for the short position
Package Name: Automotive Stock Forecast
Recommended Positions: Long
Forecast Length: 3 Months (7/22/2020 – 10/22/2020)
I Know First Average: 20.67%
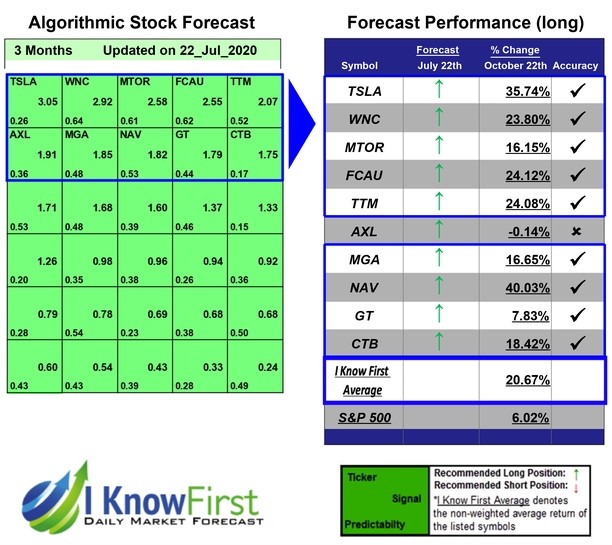
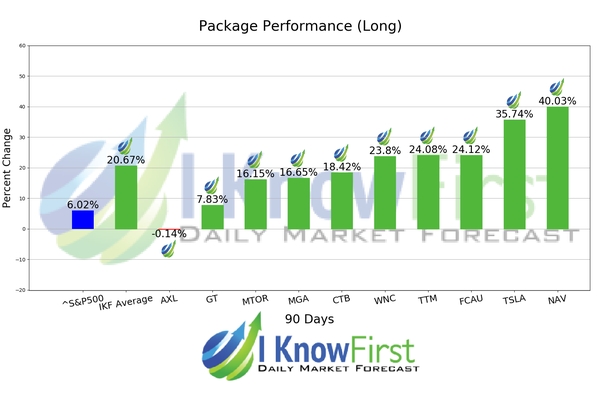
In this 3 Months forecast for the Automotive Stock Forecast Package, there were many high performing trades and the algorithm correctly predicted 9 out 10 trades. The highest trade return came from NAV, at 40.03%. Further notable returns came from TSLA and FCAU at 35.74% and 24.12%, respectively. The package saw an overall yield of 20.67% versus the S&P 500’s return of 6.02% implying a market premium of 14.65%.
Navistar International Corporation (NAV) is a US company that manufactures commercial trucks, buses, defense vehicles, and engines. Navistar consists of four operating segments: Truck, Parts, Financial Services, and Global Operations. The company is headquartered in Lisle, Illinois.
Algorithmic traders utilize these daily forecasts by the I Know First market prediction system as a tool to enhance portfolio performance, verify their own analysis and act on market opportunities faster. This forecast was sent to current I Know First subscribers.
How to interpret this diagram
Algorithmic Stock Forecast: The table on the left is a stock forecast produced by I Know First’s algorithm. Each day, subscribers receive forecasts for six different time horizons. Note that the top 10 stocks in the 1-month forecast may be different than those in the 1-year forecast. In the included table, only the relevant stocks have been included. The boxes are arranged according to their respective signal and predictability values (see below for detailed definitions). A green box represents a positive forecast, suggesting a long position, while a red represents a negative forecast, suggesting a short position.
Please note-for trading decisions use the most recent forecast. Get today’s forecast and Top stock picks.


