
Exxon Mobil Stock Forecast: Two Case Studies of “I Know First” System
Method Explained
The previous article introduced the basics of the I Know First stock forecast algorithm.
The charts below (Figs. 1 and 2) present the system actual performance on Exxon Mobil
(XOM ) price prediction. Fig. 1 shows the 90 days forecast, Fig. 2 the 30 days forecast. The thick blue line shows the actual price. The thin broken red line on the chart is the signal line. The positive or negative (up or down) signals of the forecast were added to the actual last known price at the time of forecast. Thus, when the signal line is above the actual line, it means "buy", if below, then "sell". Each point on this chart was taken from the actual daily forecast published in the morning before the next market open. Each forecast consists of six forecasts for six time horizons, from three days to one year ahead.
(click to enlarge)
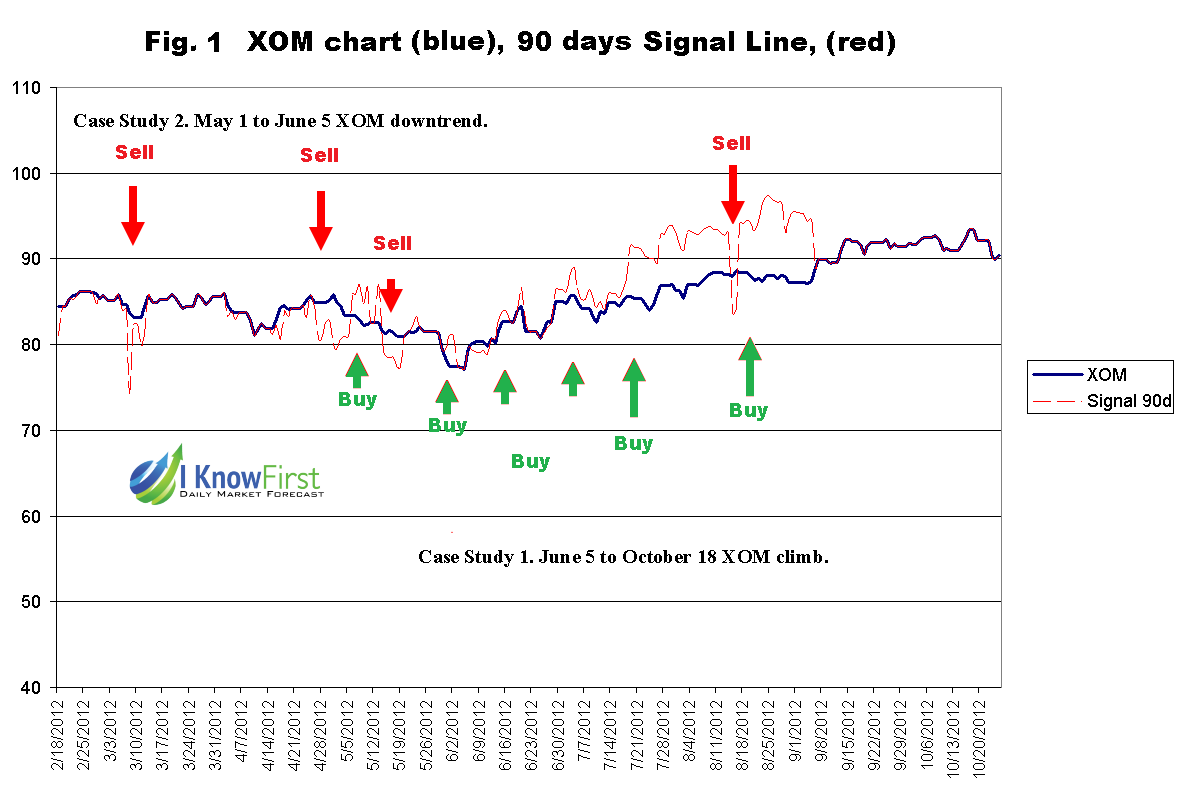
Case Study 1. June 5 to October 18 XOM climb.
Recently Exxon Mobil Corporation XOM climbed 20 percent from the bottom price of $77.6 on June 5, to a peak of 93.48 on October 18, before pulling back to 89.88 by October 24.
XOM began showing a weak up signal at first in the 90 days time horizon forecast (See Fig. 1, the right part) on June 2, then a stronger signal on June 29, then by mid July it was already signaling the upcoming uptrend in the 30 days (Figs 2) and on the short term forecasts (not shown here).
(click to enlarge)

Case Study 2. May 1 to June 5 XOM downtrend.
In the beginning of March XOM gave two strong down signals in 90 days, 30 days forecasts (Fig. 1 and 2, on the left side). After the stock was meandering mainly sideways for a while, the down signal returned in mid April in a 90 days forecast. By the end of April it was confirmed by other shorter horizon down signals (30, 14 and 7 days forecasts).
After the peak of $87.04 on May 1 the stock began to fall and continued downhill till the bottom on June 5.
Conclusions
One has to watch the market and the I KNOW FIRST signals daily, but act only on strong signals. The lowest risk entry point is the end of a long trend, when the system signals turnaround, as on May 1 or June 2.


