Best Insurance Stocks Based on Data Mining: Returns up to 7.83% in 14 Days
Best Insurance Stocks
The Insurance Companies Package is designed for investors and analysts who need stock advice for the best-performing stocks in the Insurance Company Industry. It includes 20 stocks with bullish and bearish signals and indicates the best insurance companies’ stocks to trade:
- Top 10 Insurance Company stocks for the long position
- Top 10 Insurance Company stocks for the short position

Package Name: Insurance Companies Forecast
Recommended Positions: Long
Forecast Length: 14 Days (11/28/21 – 12/13/21)
I Know First Average: 1.96%
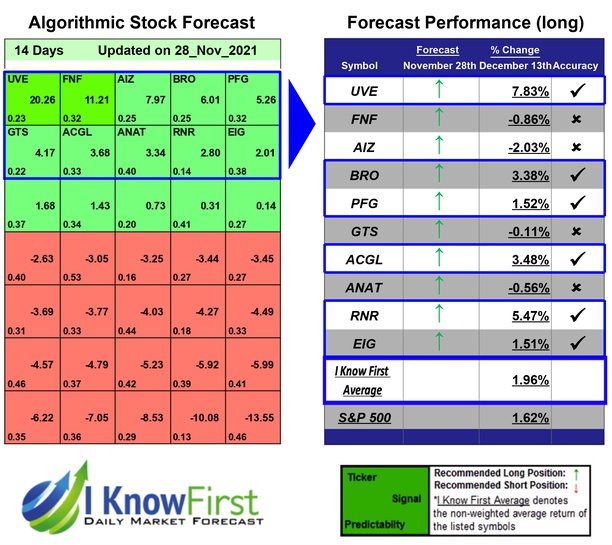
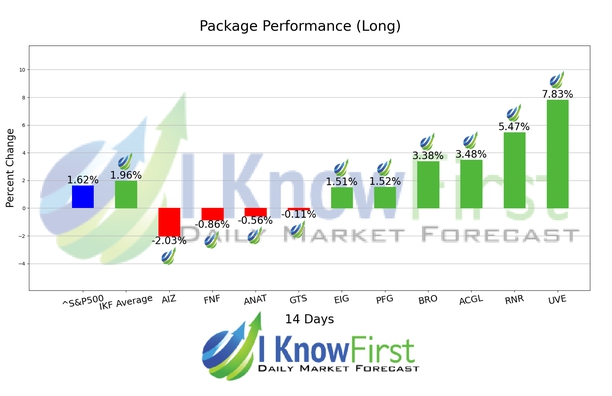
For this 14 Days forecast the algorithm had successfully predicted 6 out of 10 movements. The top-performing prediction in this forecast was UVE, which registered a return of 7.83%. RNR and ACGL followed with returns of 5.47% and 3.48% for the 14 Days period. With these notable trade returns, the package itself registered an average return of 1.96% compared to the S&P 500’s return of 1.62% for the same period.
Universal Insurance Holdings, Inc., through its subsidiaries, provides various property and casualty insurance products. The company primarily underwrites homeowners’ insurance products; and offers reinsurance intermediary services. It offers its products through a network of independent agents in Florida, Delaware, Georgia, Hawaii, Indiana, Maryland, Massachusetts, Minnesota, North Carolina, Pennsylvania, and South Carolina, the United States. The company was formerly known as Universal Heights, Inc. and changed its name to Universal Insurance Holdings, Inc. in January 2001. Universal Insurance Holdings, Inc. was founded in 1990 and is based in Fort Lauderdale, Florida.
Algorithmic traders utilize these daily forecasts by the I Know First market prediction system as a tool to enhance portfolio performance, verify their own analysis and act on market opportunities faster. This forecast was sent to current I Know First subscribers.
How to interpret this diagram
Algorithmic Stock Forecast: The table on the left is a stock forecast produced by I Know First’s algorithm. Each day, subscribers receive forecasts for six different time horizons. Note that the top 10 stocks in the 1-month forecast may be different than those in the 1-year forecast. In the included table, only the relevant stocks have been included. The boxes are arranged according to their respective signal and predictability values (see below for detailed definitions). A green box represents a positive forecast, suggesting a long position, while a red represents a negative forecast, suggesting a short position.
Please note-for trading decisions use the most recent forecast. Get today’s forecast and Top stock picks.