
Implied Volatility Based on a Self-learning Algorithm: Returns up to 220.39% in 1 Month
Implied Volatility
The Implied Volatility Options Package is designed for investors and analysts who need implied volatility predictions for options trading. It includes 20 stock options with bullish and bearish signals for implied volatility and indicates the best options to buy and sell:
- Implied volatility Top 10 call options
- Implied volatility Top 10 put options

Package Name: Implied Volatility Options
Recommended Positions: Long
Forecast Length: 1 Month (12/20/20 – 1/20/21)
I Know First Average: 84.78%
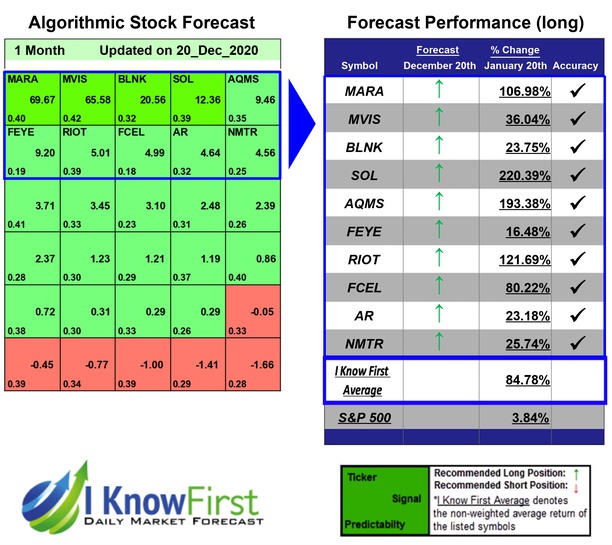

This Implied Volatility Options Package forecast had correctly predicted 10 out of 10 stock movements. SOL was the highest-earning trade with a return of 220.39% in 1 Month. Further notable returns came from AQMS and RIOT at 193.38% and 121.69%, respectively. This algorithmic forecast package presented an overall return of 84.78% versus S&P 500’s performance of 3.84% providing a market premium of 80.94%.
ReneSola Ltd, through its subsidiaries, manufactures and sells various solar power products in the People’s Republic of China and internationally. The company operates through three segments: Wafer, Cell and Module, and Solar Power Projects. It provides virgin polysilicon, monocrystalline, and multicrystalline solar wafers; and photovoltaic cells. The company also offers monocrystalline and multicrystalline solar modules for use in various residential, commercial, industrial, and other solar power generation systems, as well as offers wafer processing services. In addition, it provides solar power project development, engineering, procurement, and construction services. The company offers its products to the manufacturers of solar cells and modules, distributors, installers, and end users of solar modules. ReneSola Ltd was founded in 2005 and is headquartered in Jiashan, the People’s Republic of China.
Algorithmic traders utilize these daily forecasts by the I Know First market prediction system as a tool to enhance portfolio performance, verify their own analysis and act on market opportunities faster. This forecast was sent to current I Know First subscribers.
How to interpret this diagram
Algorithmic Stock Forecast: The table on the left is a stock forecast produced by I Know First’s algorithm. Each day, subscribers receive forecasts for six different time horizons. Note that the top 10 stocks in the 1-month forecast may be different than those in the 1-year forecast. In the included table, only the relevant stocks have been included. The boxes are arranged according to their respective signal and predictability values (see below for detailed definitions). A green box represents a positive forecast, suggesting a long position, while a red represents a negative forecast, suggesting a short position.
Please note-for trading decisions use the most recent forecast. Get today’s forecast and Top stock picks.


