
52 Week High Stocks Based on Machine Learning: Returns up to 105.45% in 1 Year
52 Week High Stocks
The 52 Week High Stocks Package is designed for investors and analysts who need predictions for stocks currently at their 52-week high price level. It includes 20 stocks with bullish and bearish signals and indicates the best shares to buy and sell:
- 52 Weeks High Top 10 stocks for the long position
- 52 Weeks High Top 10 stocks for the short position
![]()
![]()
Package Name: 52 Week High Stocks
Recommended Positions: Long
Forecast Length: 1 Year (4/28/2019 – 4/28/2020)
I Know First Average: 17.99%
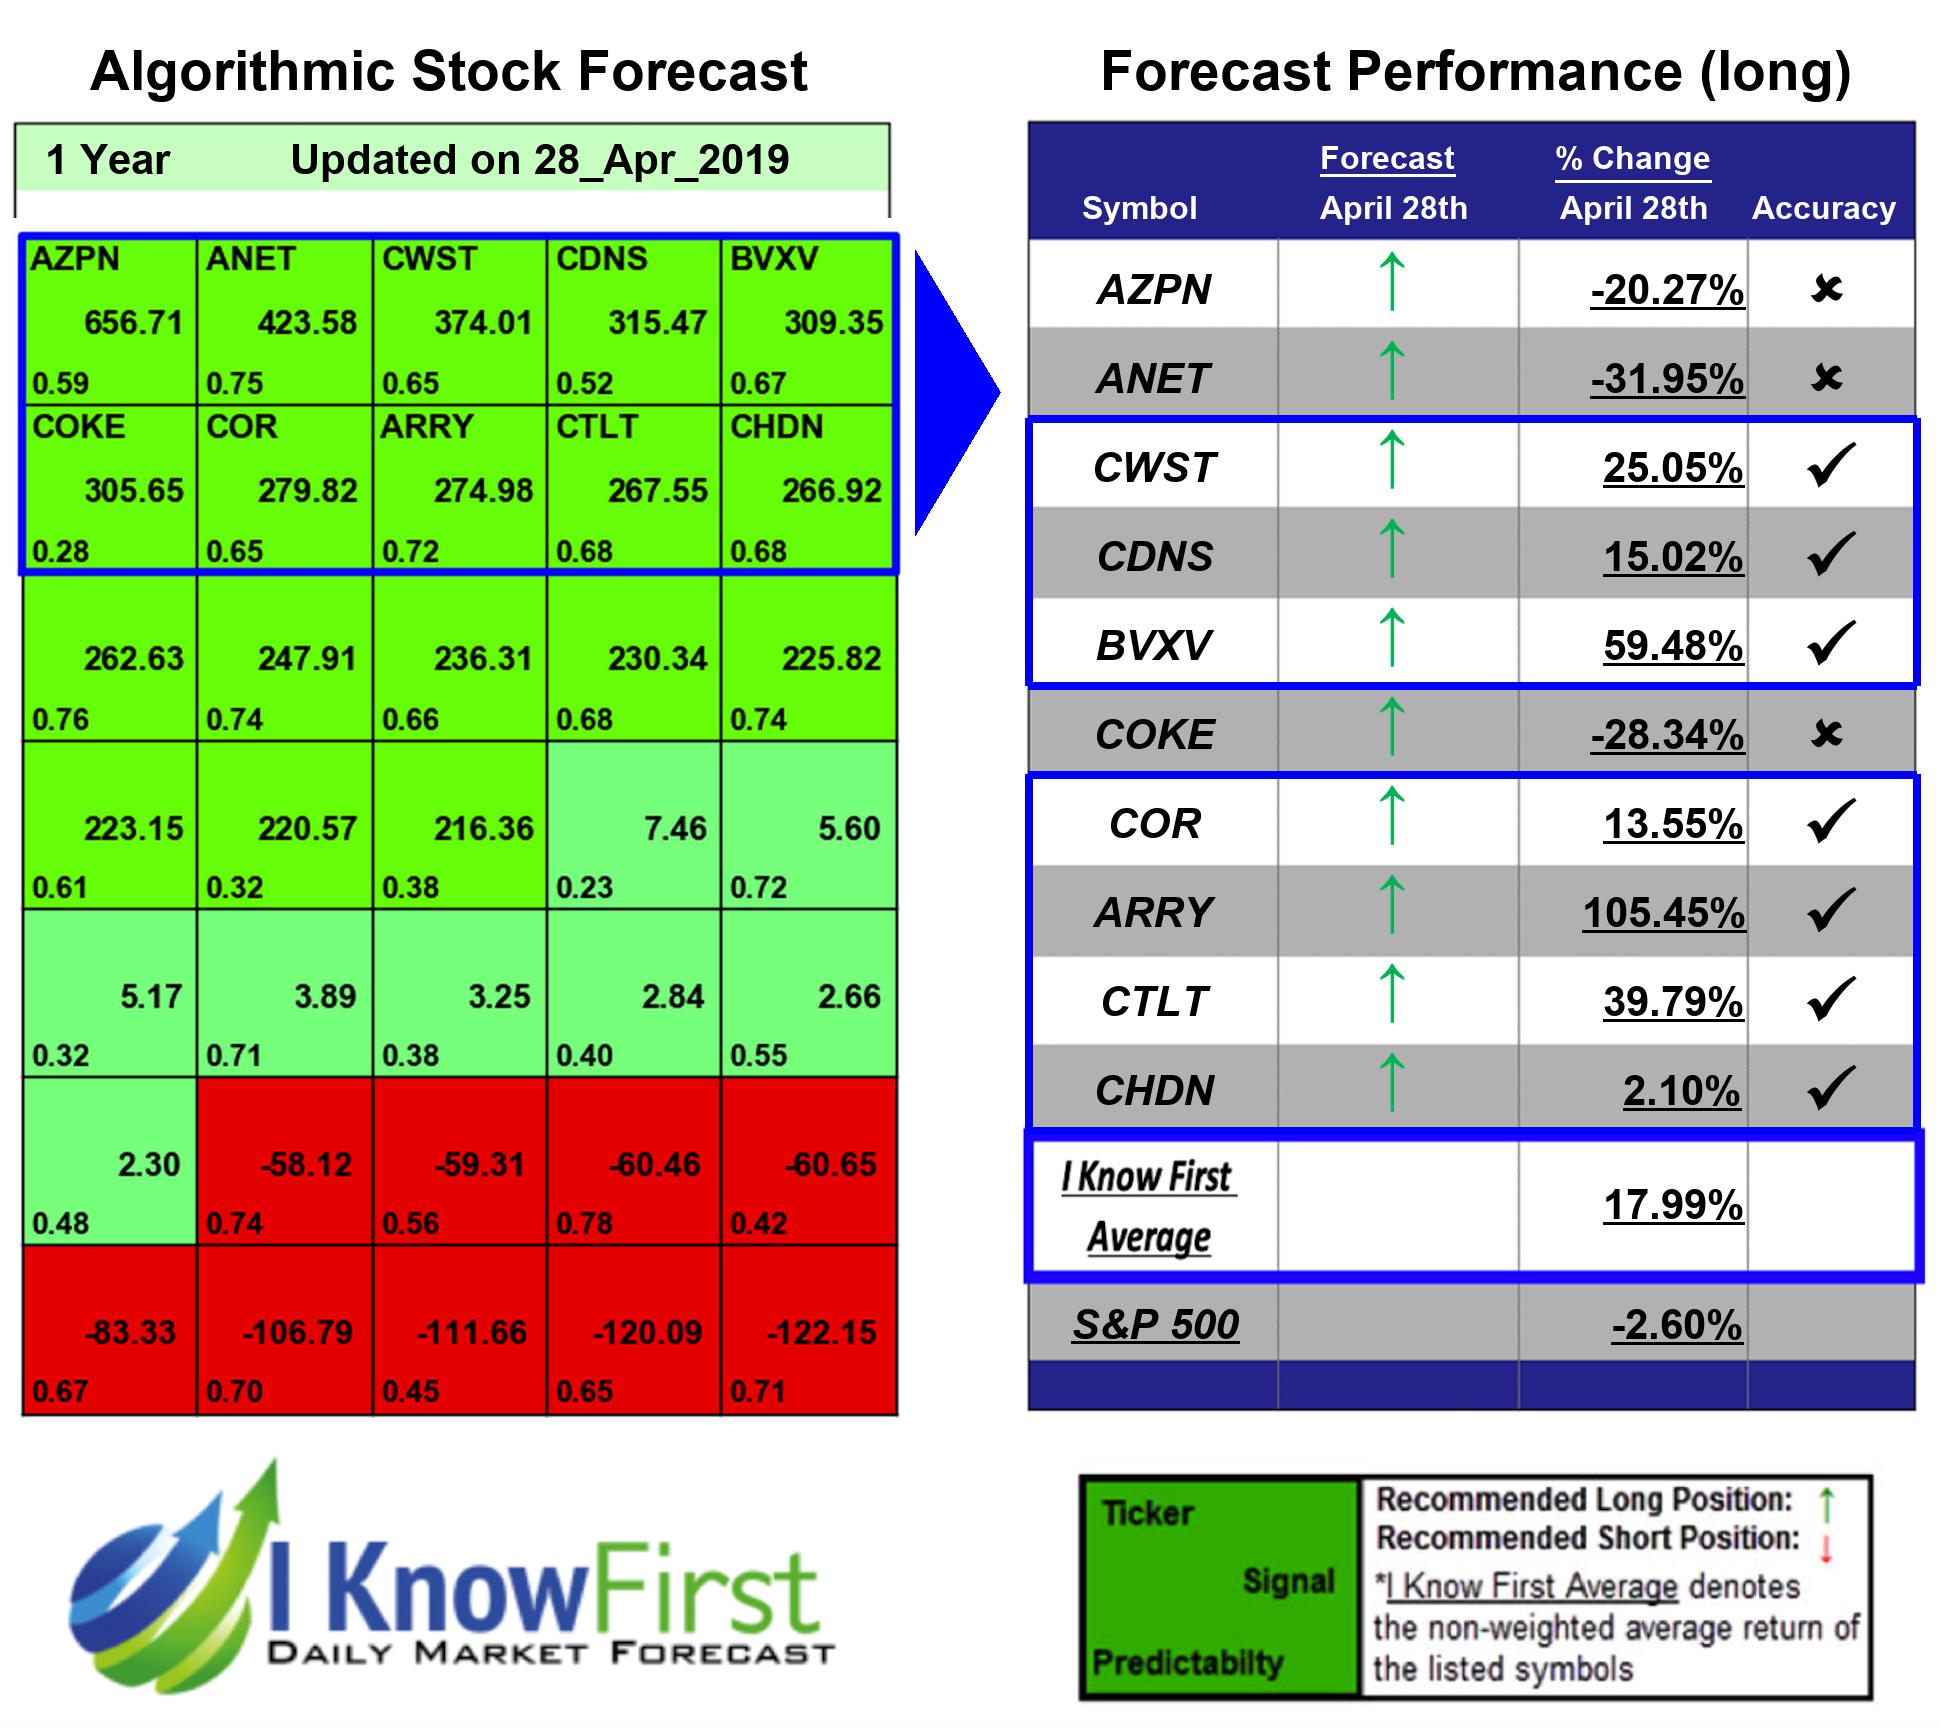

7 out of 10 stock prices in this forecast for the 52 Week High Stocks Package moved as predicted by the algorithm. ARRY was the top performing prediction with a return of 105.45%. Additional high returns came from BVXV and CTLT, at 59.48% and 39.79% respectively. The package saw an overall yield of 17.99% versus the S&P 500’s return of -2.6% implying a market premium of 20.59%.
Array BioPharma Inc. (ARRY) is a biopharmaceutical company, that is involved in discovery research and drug creation. The Company provides drug discovery products and services to create, evaluate, and optimize potential drug candidates in collaboration with pharmaceutical and other biotechnology companies.
Algorithmic traders utilize these daily forecasts by the I Know First market prediction system as a tool to enhance portfolio performance, verify their own analysis and act on market opportunities faster. This forecast was sent to current I Know First subscribers.
How to interpret this diagram
Algorithmic Stock Forecast: The table on the left is a stock forecast produced by I Know First’s algorithm. Each day, subscribers receive forecasts for six different time horizons. Note that the top 10 stocks in the 1-month forecast may be different than those in the 1-year forecast. In the included table, only the relevant stocks have been included. The boxes are arranged according to their respective signal and predictability values (see below for detailed definitions). A green box represents a positive forecast, suggesting a long position, while a red represents a negative forecast, suggesting a short position.
Please note-for trading decisions use the most recent forecast. Get today’s forecast and Top stock picks.


