
52 Week High Stocks Based on Big Data: Returns up to 60.41% in 1 Year
52 Week High Stocks
The 52 Week High Stocks Package is designed for investors and analysts who need predictions for stocks currently at their 52-week high price level. It includes 20 stocks with bullish and bearish signals and indicates the best shares to buy and sell:
- 52 Weeks High Top 10 stocks for the long position
- 52 Weeks High Top 10 stocks for the short position
![]()
![]()
Package Name: 52 Week High Stocks
Recommended Positions: Long
Forecast Length: 1 Year (8/30/2018 – 8/30/2019)
I Know First Average: 9.26%

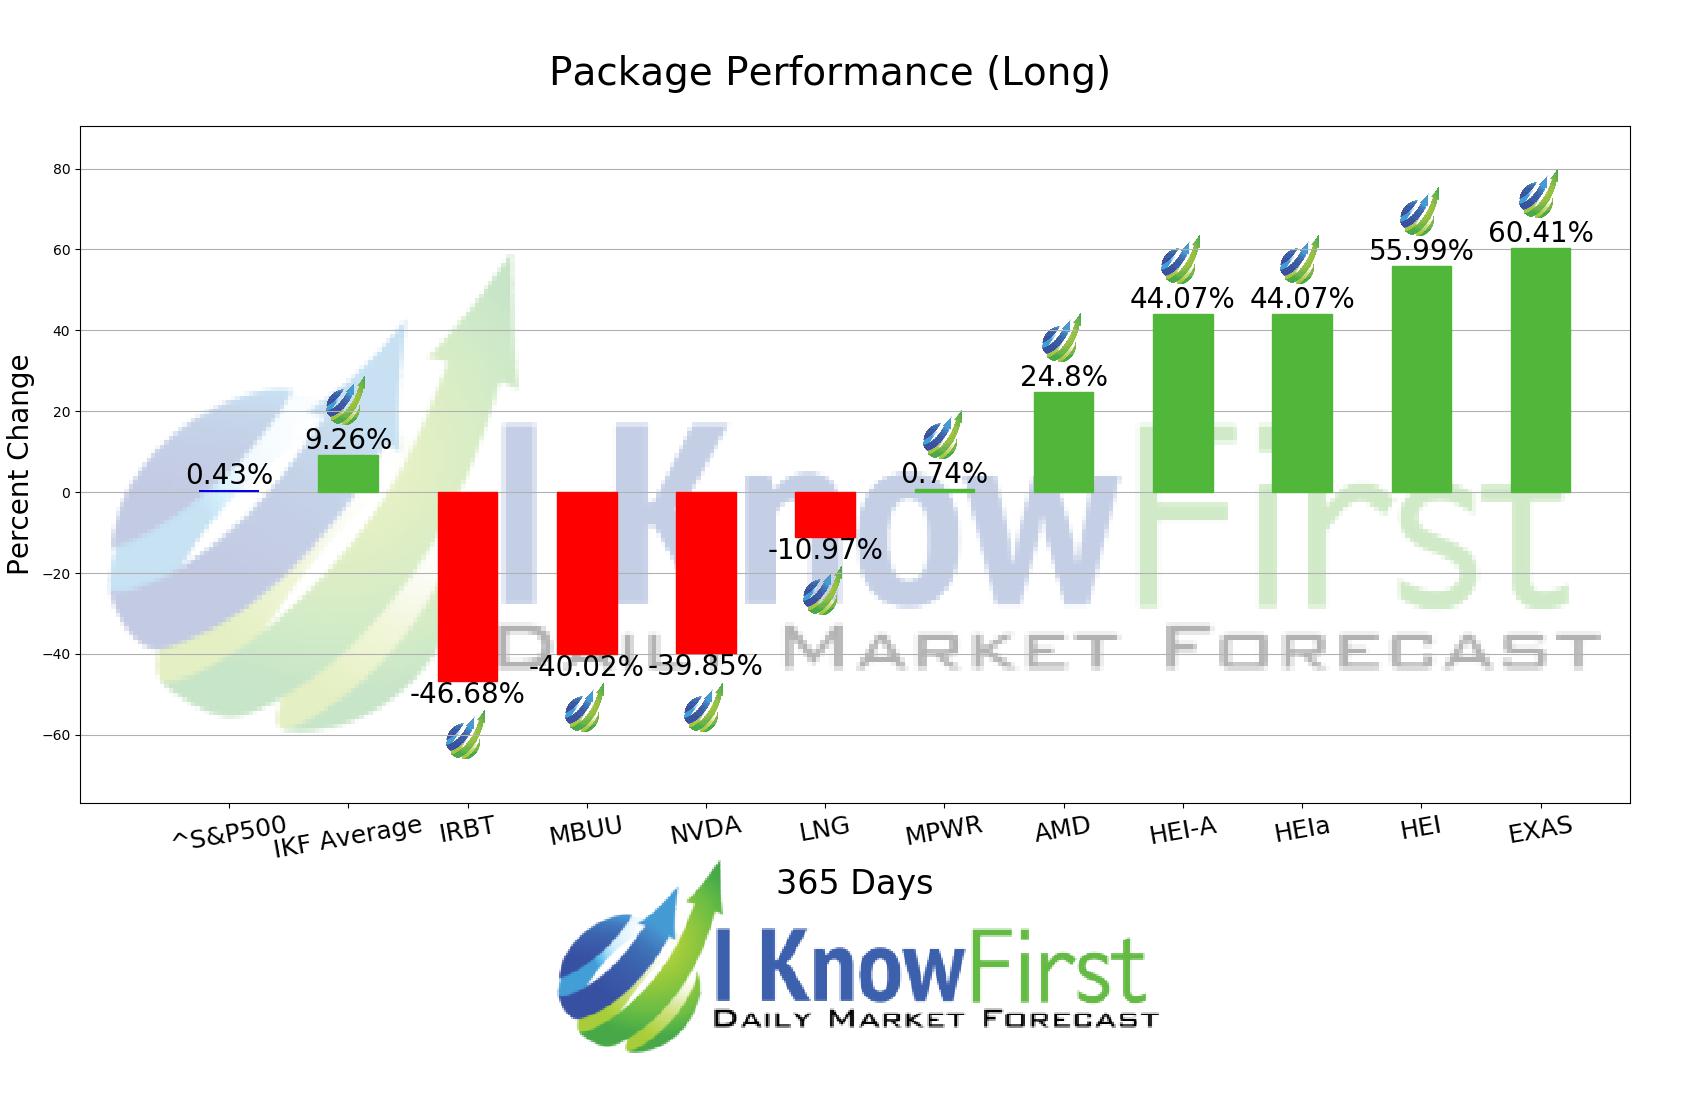
Several predictions in this 1 Year forecast saw significant returns. The algorithm had correctly predicted 6 out 10 stock movements. The greatest return came from EXAS at 60.41%. HEI and HEI-A followed with returns of 55.99% and 44.07% for the 1 Year period. The package had an overall average return of 9.26%, providing investors with a premium of 8.83% over the S&P 500’s return of 0.43% during the same period.
Exact Sciences Corporation, a molecular diagnostics company, focuses on developing products for the early detection and prevention of various cancers in the United States. Exact Sciences Corporation was founded in 1995 and is headquartered in Madison, Wisconsin.
Algorithmic traders utilize these daily forecasts by the I Know First market prediction system as a tool to enhance portfolio performance, verify their own analysis and act on market opportunities faster. This forecast was sent to current I Know First subscribers.
How to interpret this diagram
Algorithmic Stock Forecast: The table on the left is a stock forecast produced by I Know First’s algorithm. Each day, subscribers receive forecasts for six different time horizons. Note that the top 10 stocks in the 1-month forecast may be different than those in the 1-year forecast. In the included table, only the relevant stocks have been included. The boxes are arranged according to their respective signal and predictability values (see below for detailed definitions). A green box represents a positive forecast, suggesting a long position, while a red represents a negative forecast, suggesting a short position.
Please note-for trading decisions use the most recent forecast. Get today’s forecast and Top stock picks.


