
52 Week High Based on Stock Algorithm: Returns up to 50.45% in 3 Months
52 Week High
The 52 Week High Stocks Package is designed for investors and analysts who need predictions for stocks currently at their 52-week high price level. It includes 20 stocks with bullish and bearish signals and indicates the best shares to buy and sell:
- 52 Weeks High Top 10 stocks for the long position
- 52 Weeks High Top 10 stocks for the short position
![]()
![]()
Package Name: 52 Week High Stocks
Recommended Positions: Long
Forecast Length: 3 Months (9/24/2019 – 12/24/2019)
I Know First Average: 18.33%

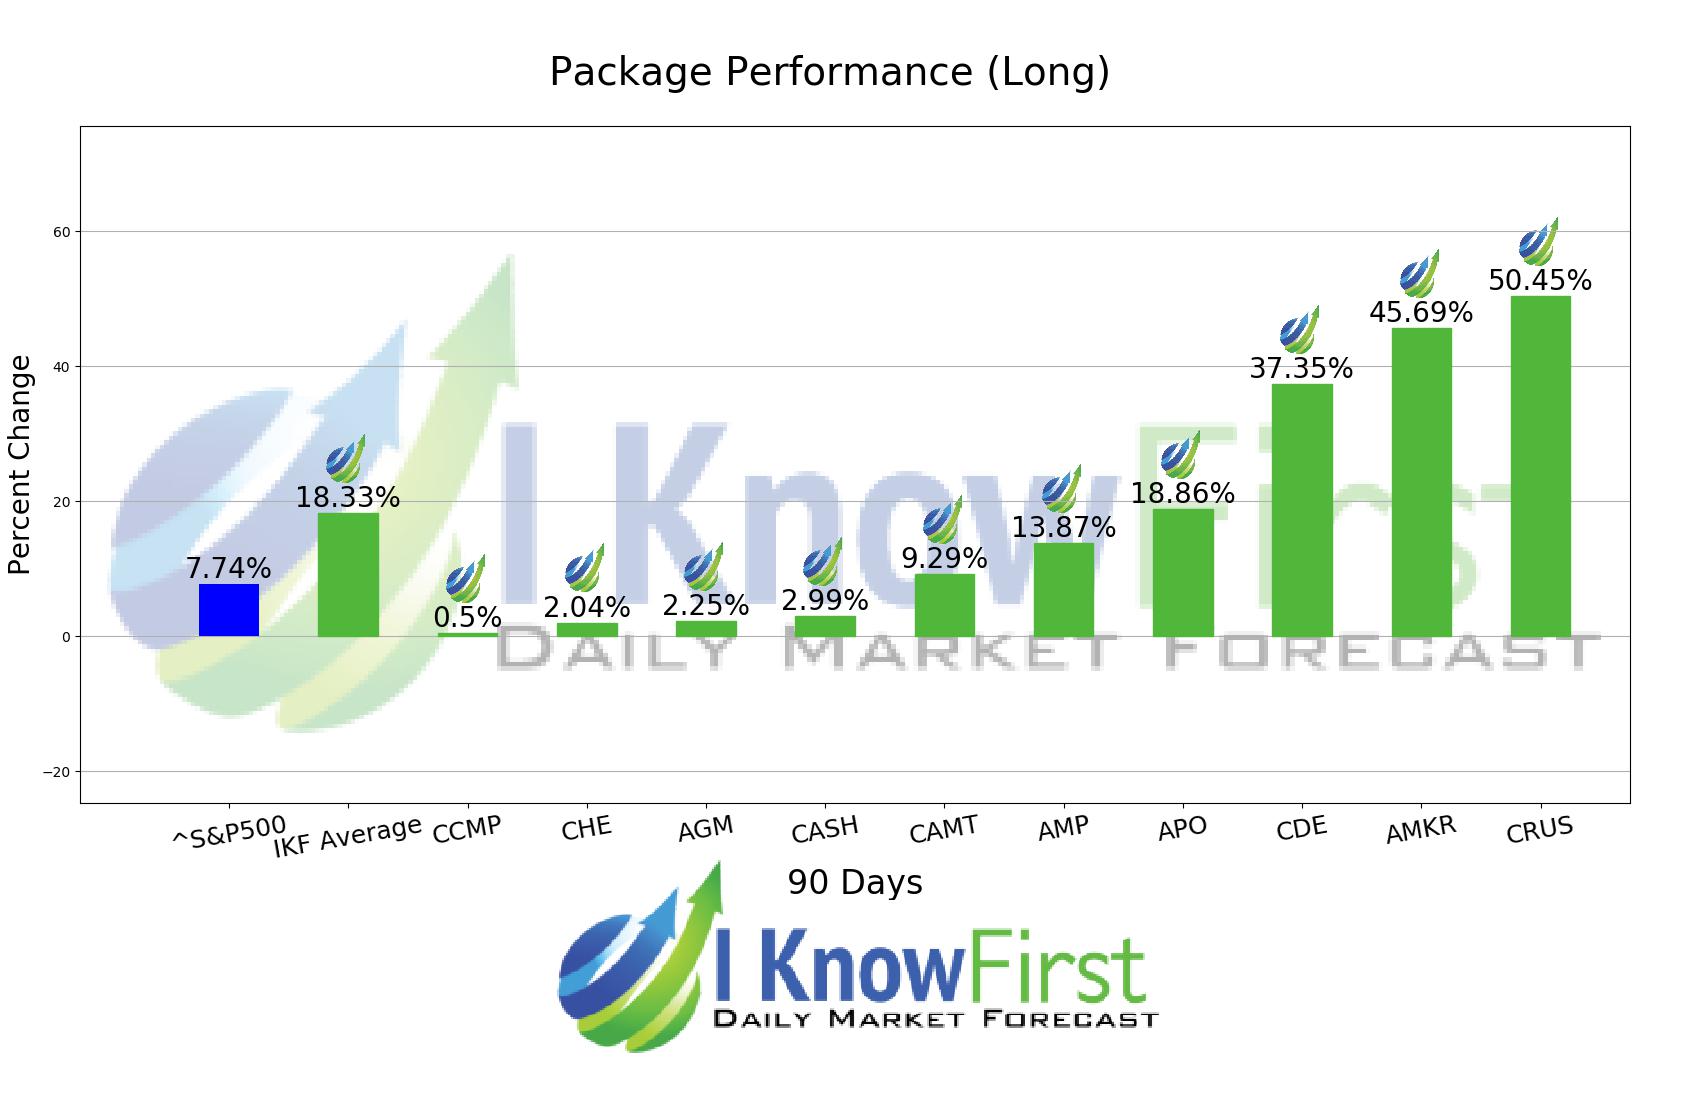
Several predictions in this 3 Months forecast saw significant returns. The algorithm had correctly predicted 10 out 10 stock movements. CRUS was the highest-earning trade with a return of 50.45% in 3 Months. Further notable returns came from AMKR and CDE at 45.69% and 37.35%, respectively. With these notable trade returns, the package itself registered an average return of 18.33% compared to the S&P 500’s return of 7.74% for the same period.
Cirrus Logic Inc. (CRUS) is located in Austin, Texas since 2015 where they still have their headquarters. They are the suppliers of fabless semiconductor that specializes in analog, mixed-signal, and audioDSP integrated circuits.
Algorithmic traders utilize these daily forecasts by the I Know First market prediction system as a tool to enhance portfolio performance, verify their own analysis and act on market opportunities faster. This forecast was sent to current I Know First subscribers.
How to interpret this diagram
Algorithmic Stock Forecast: The table on the left is a stock forecast produced by I Know First’s algorithm. Each day, subscribers receive forecasts for six different time horizons. Note that the top 10 stocks in the 1-month forecast may be different than those in the 1-year forecast. In the included table, only the relevant stocks have been included. The boxes are arranged according to their respective signal and predictability values (see below for detailed definitions). A green box represents a positive forecast, suggesting a long position, while a red represents a negative forecast, suggesting a short position.
Please note-for trading decisions use the most recent forecast. Get today’s forecast and Top stock picks.


