I Know First Review: December 15th
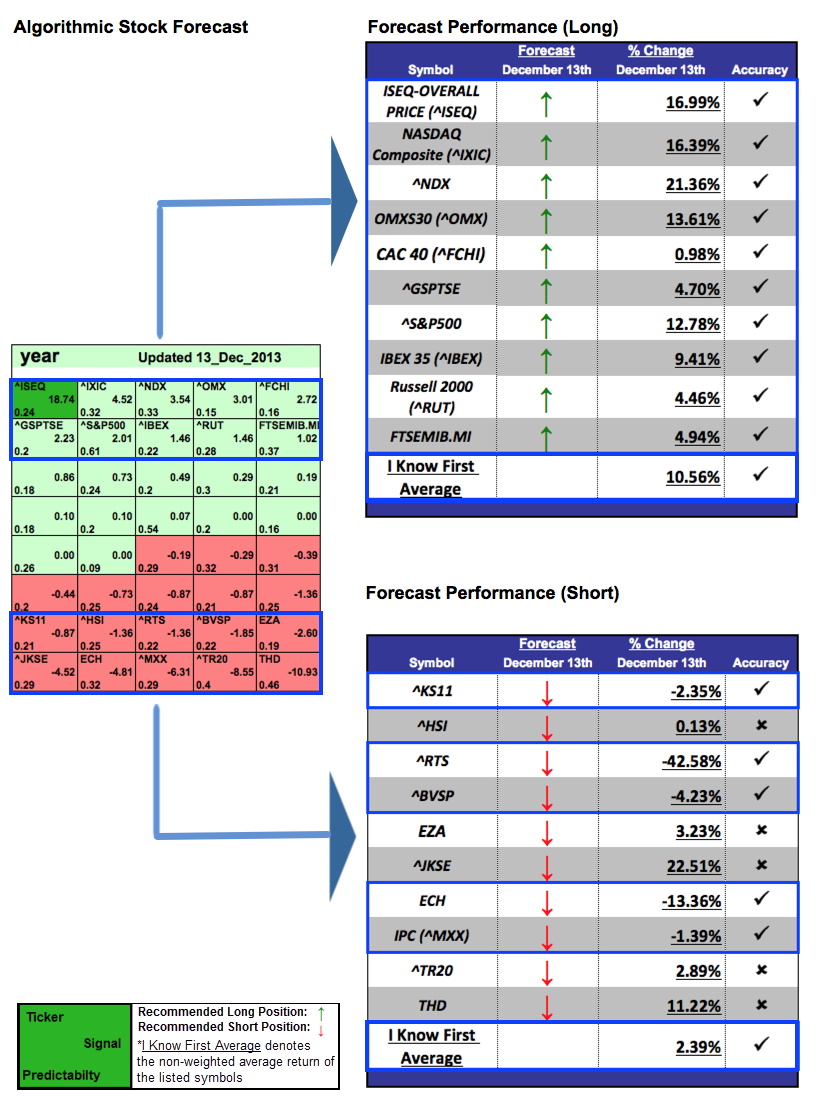
The stocks selected here are the top performing aggressive stocks from I Know First: Daily Market Forecast’s December 8th, 2014 stock forecast titled Indices Forecast Based On Algorithms: Up To 21.36% (Long) & 42.58% (Short) Return In 1 Year. This forecast is part of the “World Indices” package, as one of I Know First’s quantitative investment solutions. The “I Know First Average” return was 10.56% for the long position and 2.39%for the short position.
Learn how to read the predictions: Instructions
Learn how to strategize with the forecast: Algorithmic Trading Strategies
Irish Stock Exchange Overall Index

Signal (1 year): 18.74
Predictability (1 year): 0.24
Return: 16.99%
The Irish Stock Exchange is Ireland’s only stock exchange, and has been in existence since 1793. In 1995, it became independent from the London Stock Exchange and since then has expanded internationally and established itself as a global listing centre for international fund and debt securities. ^ISEQ had a signal strength of 18.74 and a predictability indicator of 0.24. In accordance with the algorithm prediction, the stock returned 16.99% in a one-year time horizon. The Gross Domestic Product (GDP) in Ireland expanded 3.50 percent in the third quarter of 2014 over the same quarter of the previous year. Dublin said the news showed that the sacrifices of the Irish people, and policies designed to increase exports, had borne fruit. Ministers are already debating how to spend higher-than-forecast tax revenues, less than a year after the country finished its three-year EU-International Monetary Fund bailout programme.
NASDAQ Stock Market
Signal (1 year): 4.52
Predictability (1 year): 0.32
Return: 16.39%
The NASDAQ Stock Market commonly known as the NASDAQ, is an American stock exchange. In terms of market share and volume traded, it is the largest stock exchange in the U.S. The Nasdaq Composite had a signal strength of 4.52 and a predictability indicator of 0.32. In accordance with the algorithm prediction, the index returned 16.39% in a one-year time horizon. In general, 2014 was a good year for the U.S. economy. Investors received a variety of signals during the year 2014 that the U.S. economy was picking up speed in the second half of the year, as many had predicted, increasing then confidence in the US stock market. Labor market data were especially strong, with payroll statistics reaching their most favorable levels since the late 1990s, by some measures. The manufacturing sector remained robust, while a better job market and rising consumer spending appeared to drive healthy growth in the much larger service sector. Investors were also relieved to see evidence that the housing sector had regained traction as homebuyers reconciled themselves to somewhat higher home prices and mortgage rates. US Stock market is expected to continue to grow steadily in 2015.
NASDAQ 100

Signal (1 year): 3.54
Predictability (1 year): 0.33
Return: 21.36%
The NASDAQ-100 is a stock market index made up of 104 stocks issued by 100 of the largest non-financial companies listed on the NASDAQ. It is a modified capitalization-weighted index. The stocks’ weights in the index are based on their market capitalizations, with certain rules capping the influence of the largest components. The Nasdaq-100 had a signal strength of 3.54 and a predictability indicator of 0.33. In accordance with the algorithm prediction, the index returned 21.36% in a one-year time horizon. As the US economy is
OMX Stockholm 30 Index

Signal (1 year): 3.01
Predictability (1 year): 0.15
Return: 13.61%
The OMX Stockholm 30 (OMXS30) is a stock market index for the Stockholm Stock Exchange. It is a capitalization-weighted index that consists of the 30 most-traded stock classes. ^OMX had a signal strength of 3.01 and a predictability indicator of 0.15. In accordance with the algorithm prediction, the index returned 13.61% in a one-year time horizon.
CAC40

Signal (1 year): 2.72
Predictability (1 year): 0.16
Return: 0.98%
The CAC 40 is a benchmark French stock market index. The index represents a capitalization-weighted measure of the 40 most significant values among the 100 highest market caps on the Euronext Paris. It is one of the main national indices of the pan-European stock exchange group Euronext.^FCHI had a signal strength of 2.72 and a predictability indicator of 0.16. In accordance with the algorithm prediction, the index returned 0.98% in a one-year time horizon.
S&P/TSX Composite Index

Signal (1 year): 2.23
Predictability (1 year): 0.2
Return: 4.7%
The S&P/TSX Composite is the headline index for the Canadian equity market. It is the broadest in the S&P/TSX family and is the basis for multiple sub-indices including but not limited to equity indices, Income Trust Indices, Capped Indices, GICS Indices and market cap based indices. The Toronto Stock Exchange (TSX) serves as the distributor of both real-time and historical data for this index. ^GSPTSE had a signal strength of 2.23 and a predictability indicator of 0.2. In accordance with the algorithm prediction, the index returned 4.7% in a one-year time horizon.
S&P 500
Signal (1 year): 2.01
Predictability (1 year): 0.61
Return: 12.78%
The S&P 500 (Standard & Poor’s 500) is an American stock market index based on the market capitalisation of 500 large companies having common stock listed on the NYSE or NASDAQ. It is widely regarded as the best single gauge of large cap U.S. equities. There is over USD 7 trillion benchmarked to the index, with index assets comprising approximately USD 1.9 trillion of this total. S&P 500 had a signal strength of 2.01 and a predictability indicator of 0.61. In accordance with the algorithm prediction, the index returned 12.78% in a one-year time horizon.
IBEX 35 – Spanish Exchange Index

Signal (1 year): 1.46
Predictability (1 year): 0.22
Return: 9.41%
The IBEX 35 is the benchmark stock market index of the Bolsa de Madrid, Spain’s principal stock exchange. Initiated in 1992, the index is administered and calculated by Sociedad de Bolsas, the company which runs Spain’s securities markets (including the Bolsa de Madrid). It is a market capitalization weighted index comprising the 35 most liquid Spanish stocks traded in the Madrid Stock Exchange General Index and is reviewed twice annually. ^Ibex had a signal strength of 1.46 and a predictability indicator of 0.22. In accordance with the algorithm prediction,the index returned 9.71% in a one-year time horizon.
Russel 2000 Index
Signal (1 year): 1.46
Predictability (1 year): 0.28
Return: 4.46%
The Russell 2000 Index is a small-cap stock market Index of the bottom 2,000 stocks in the Russell 3000 Index. The Russell 2000 is by far the most common benchmark for mutual Funds that identify themselves as “small cap”, while the S&P500 index is used primarily for large capitalization stocks. It is the most widely quoted measure of the overall performance of the small-cap to mid-cap company shares. ^RUT had a signal strength of 1.46 and a predictability indicator of 0.28. In accordance with the algorithm prediction, the index returned 4.46% in a one-year time horizon.
FTSE MIB Index

Signal (1 year): 1.02
Predictability (1 year): 0.37
Return: 4.94%
The Index will consist of the 40 most liquid and capitalized stocks listed on the Borsa Italiana. In the FTSE MIB Index foreign shares will be eligible for inclusion. ^FTSE had a signal strength of 1.02 and a predictability indicator of 0.37. In accordance with the algorithm prediction, the index returned 4.94% in a one-year time horizon.
KOSPI Composite Index – Korea Stock Exchange

Signal (1 year): -0.87
Predictability (1 year): 0.21
Return: -2.35%
The Korea Composite Stock Price Index is the index of all common stocks traded on the Stock Market Division of the Korea Exchange. It is the representative stock market index of South Korea, like the S&P 500 in USA. KOSPI was introduced in 1983 with the base value of 100 as of January 4, 1980. It is calculated based on market capitalization. ^KS11 had a signal strength of -0.87 and a predictability indicator of 0.21. In accordance with the algorithm prediction,the index dropped by 4.94% in a one-year time horizon.
RTS Index – ‘Russia Trading System’

Signal (1 year): -1.36
Predictability (1 year): 0.21
Return: -42.58%
The RTS Index”Russia Trading System’ is a free-float capitalization-weighted index of 50 Russian stocks traded on the Moscow Exchange in Moscow, Russia. The list of stocks is reviewed every three months by the RTS Information Committee. The RTS Index value is calculated in a real-time mode. The index was introduced on September 1, 1995 with a base value of 100. ^RTS had a signal strength of -1.36 and a predictability indicator of 0.22. In accordance with the algorithm prediction, the index dropped by 42.58% in a one-year time horizon. Russian stocks have been falling like the rest of the world. However, there’s one notable difference. They are leading the way down. On top of that, Russia is the world’s biggest supplier of energy, especially oil and natural gas. Both of these have had such “demand destruction” that it has crippled their markets as the profit margins are all gone. This drop in commodity prices has caused traders and investors alike to lose confidence in their stocks (which as dropped 18% this year on the RTS index) and their currency.
IBOVESPA Index – Brazil
![]()
![]()
Signal (1 year): -1.85
Predictability (1 year): 0.22
Return: -4.23%
The Bovespa Index is an index of about 50 stocks that are traded on the Sao Paulo Stock, Mercantile & Futures Exchange. ^BVSP had a signal strength of -1.85 and a predictability indicator of 0.22. In accordance with the algorithm prediction, the index dropped by 4.23% in a one-year time horizon.
iShares MSCI Chile Capped Investable Market Index Fund

Signal (1 year): -4.81
Predictability (1 year): 0.32
Return: -13.36%
iShares MSCI Chile Capped ETF is an exchange-traded fund incorporated in the USA. The ETF seeks investment results that correspond to the MSCI Chile IMI 25/50 Index. ^ECH had a signal strength of -4.81 and a predictability indicator of 0.32. In accordance with the algorithm prediction, the index dropped by 13.36% in a one-year time horizon.
Mexico IPC Index

Signal (1 year): -6.31
Predictability (1 year): 0.29
Return: -1.39%
The Índice de Precios y Cotizaciones (IPC) is an index of 35 stocks that trade on the Bolsa Mexicana de Valores. It is the broadest indicator of the BMV’s overall performance. It is made up of a balanced weighted selection of shares that are representative of all the shares listed on the exchange from various sectors across the economy, and is revised twice a year. ^MXX had a signal strength of -6.31 and a predictability indicator of 0.29. In accordance with the algorithm prediction, the index dropped by 1.39% in a one-year time horizon.