
Quant Finance Using Genetic Algorithms: Up To 32.05% Return In 1 Month
Quant Finance Using Genetic Algorithms
This forecast is part of the “Top 10 Stock Picks” package, as one of I Know First’s algorithmic trading tools. The full Top 10 Stock Picks forecast includes a daily predictions for a total of 20 stocks with bullish and bearish signals:
- top ten stocks picks to long
- top ten stocks picks to short
- S&P 500 forecast
Package Name: Top 10 Stocks
Forecast Length: 1 Month (7/24/2015 – 8/24/2015)
I Know First Average: 15.32% (Short)
Get the “Top 10 Stocks”-Package
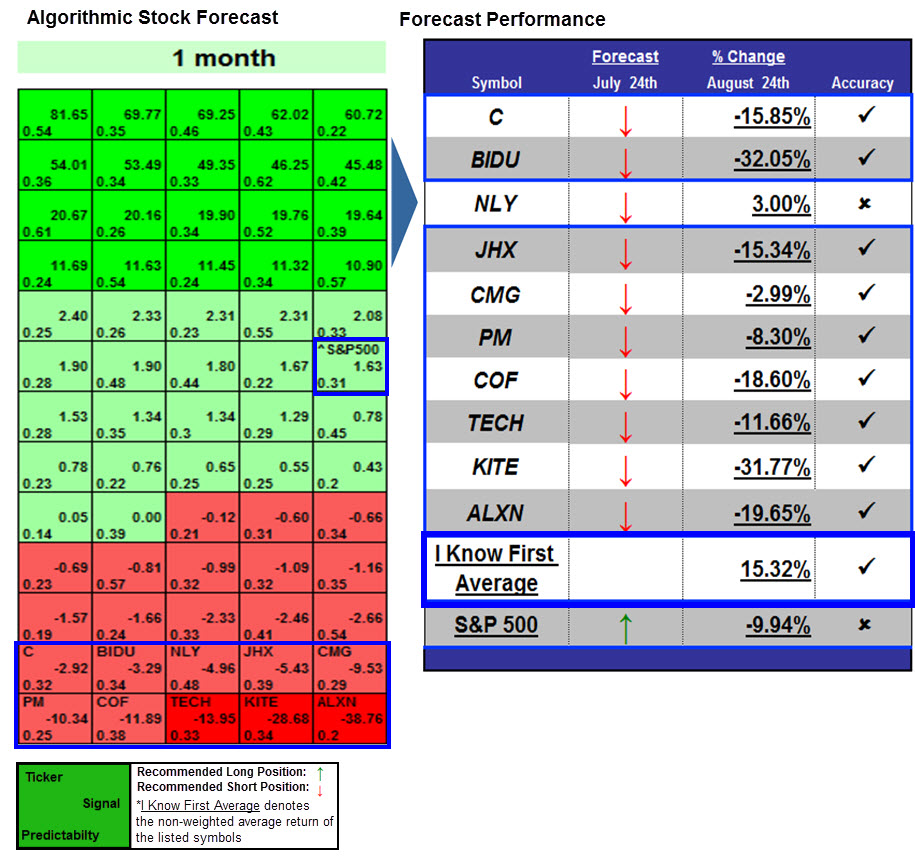
9 out of the 10 stocks included in the Top 10 Stocks forecast from 07/24/15 decreased in accordance with the algorithm’s prediction for the 3 month time horizon. The top performing stock was Baidu Inc (BIDU) with immense return of 32.05%. Kite Pharma Inc. (KITE) and Alexion Pharmaceuticals Inc, (ALXN) also posted outstanding returns of 31.77% and 19.65% during that time period, offering large returns to investors. Investors using the I Know First service who invested evenly in these stocks would have outperformed the S&P 500 average of -9.94% by 25.26% during the predicted time horizon.
Baidu, China’s largest search engine provider reacted poorly to the recent crumbling Asain markets, as predicted. The Chinese web services, headquartered at the Baidu Campus in Beijing’s Haidian District, has had a roller-coaster ride as its stocks peaked at $251.99 last November, but are now at a pitiful 39.3%. The company see that Earnings from continuing operations have fallen in each of this year’s first two quarters, and analysts see a decline of more than 10% in adjusted earnings for all of 2015. Again compounding to Baidu’s poor performance.
Algorithmic traders utilise these daily forecasts by the I Know First market prediction system as a tool to enhance portfolio performance, verify their own analysis and act on market opportunities faster. This forecast was sent to current I Know First algorithmic traders.


