
Warren Buffett Stocks Based on Pattern Recognition: Returns up to 75.75% in 14 Days
Warren Buffett Stocks
This Warren Buffett Stocks Portfolio is part of the Buffett’s Top 10 Package, as one of I Know First’s quantitative investment solutions. Investors generally utilize the I Know First advanced self-learning algorithm to take advantage of Warren Buffett’s proven investing strategy. The full Top 10 Warren Buffett’s Stocks Package includes the best stocks identified by the algorithm that are currently in Warren Buffett’s portfolio:
- Top 10 Warren Buffett’s stocks for long position
- Top 10 Warren Buffett’s stocks for short position

Package Name: Warren Buffett Portfolio
Recommended Positions: Long
Forecast Length: 14 Days (5/26/2020 – 6/9/2020)
I Know First Average: 26.71%
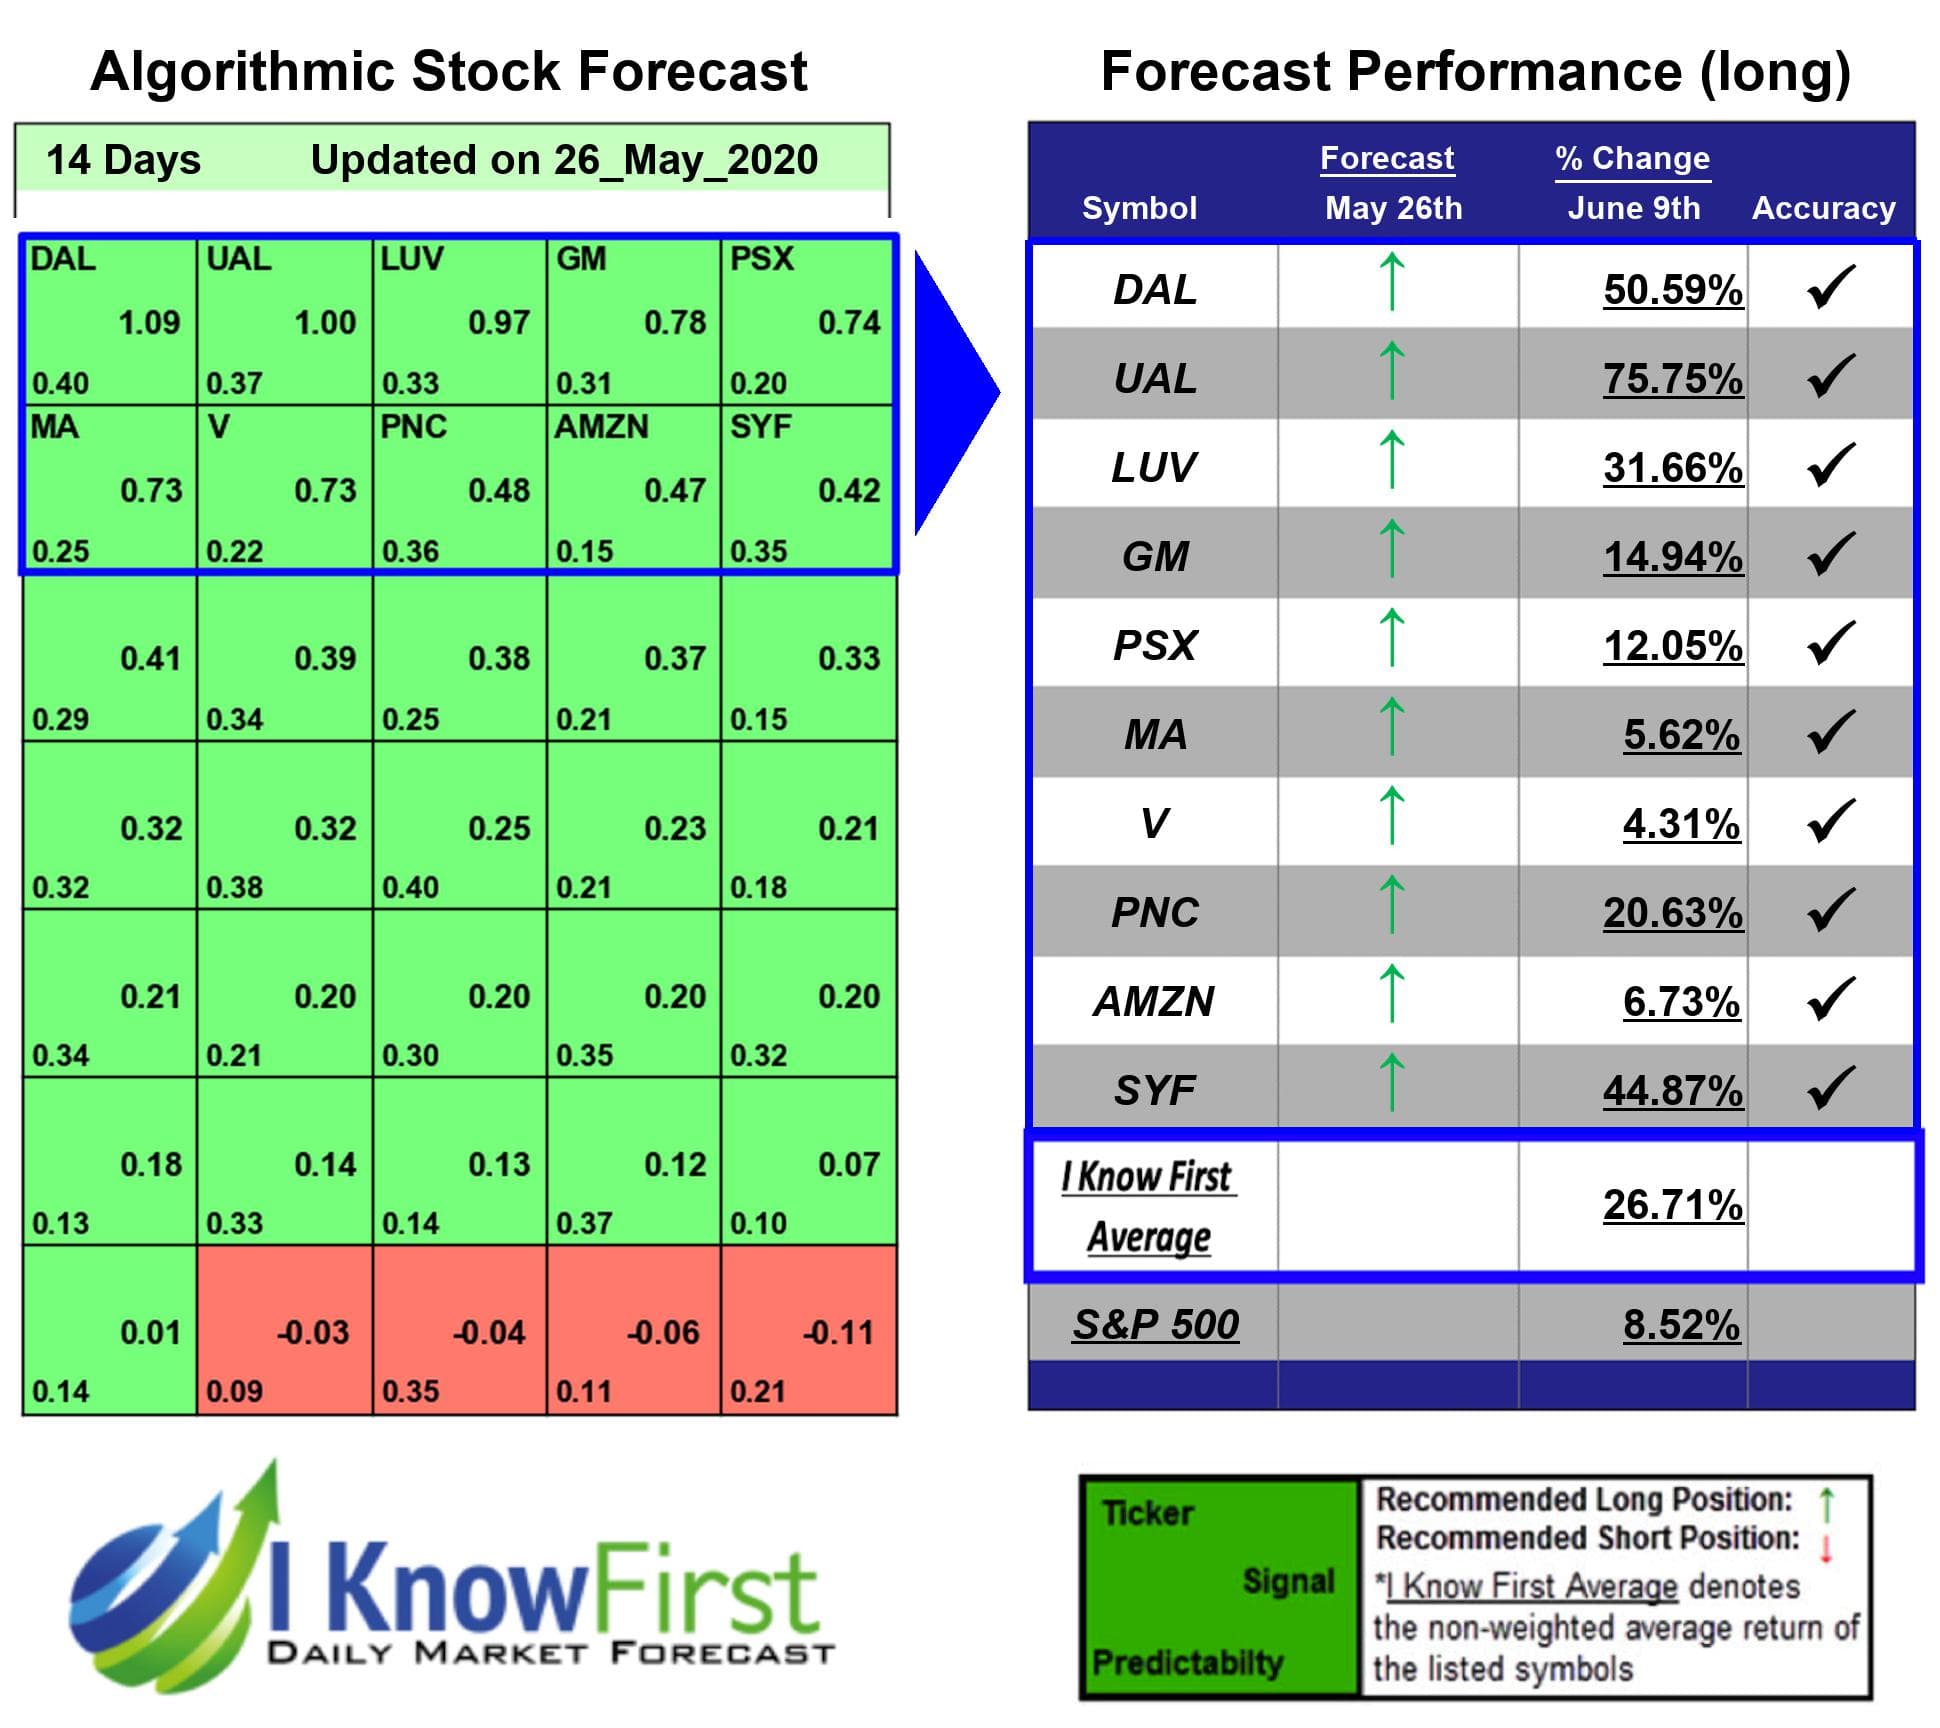
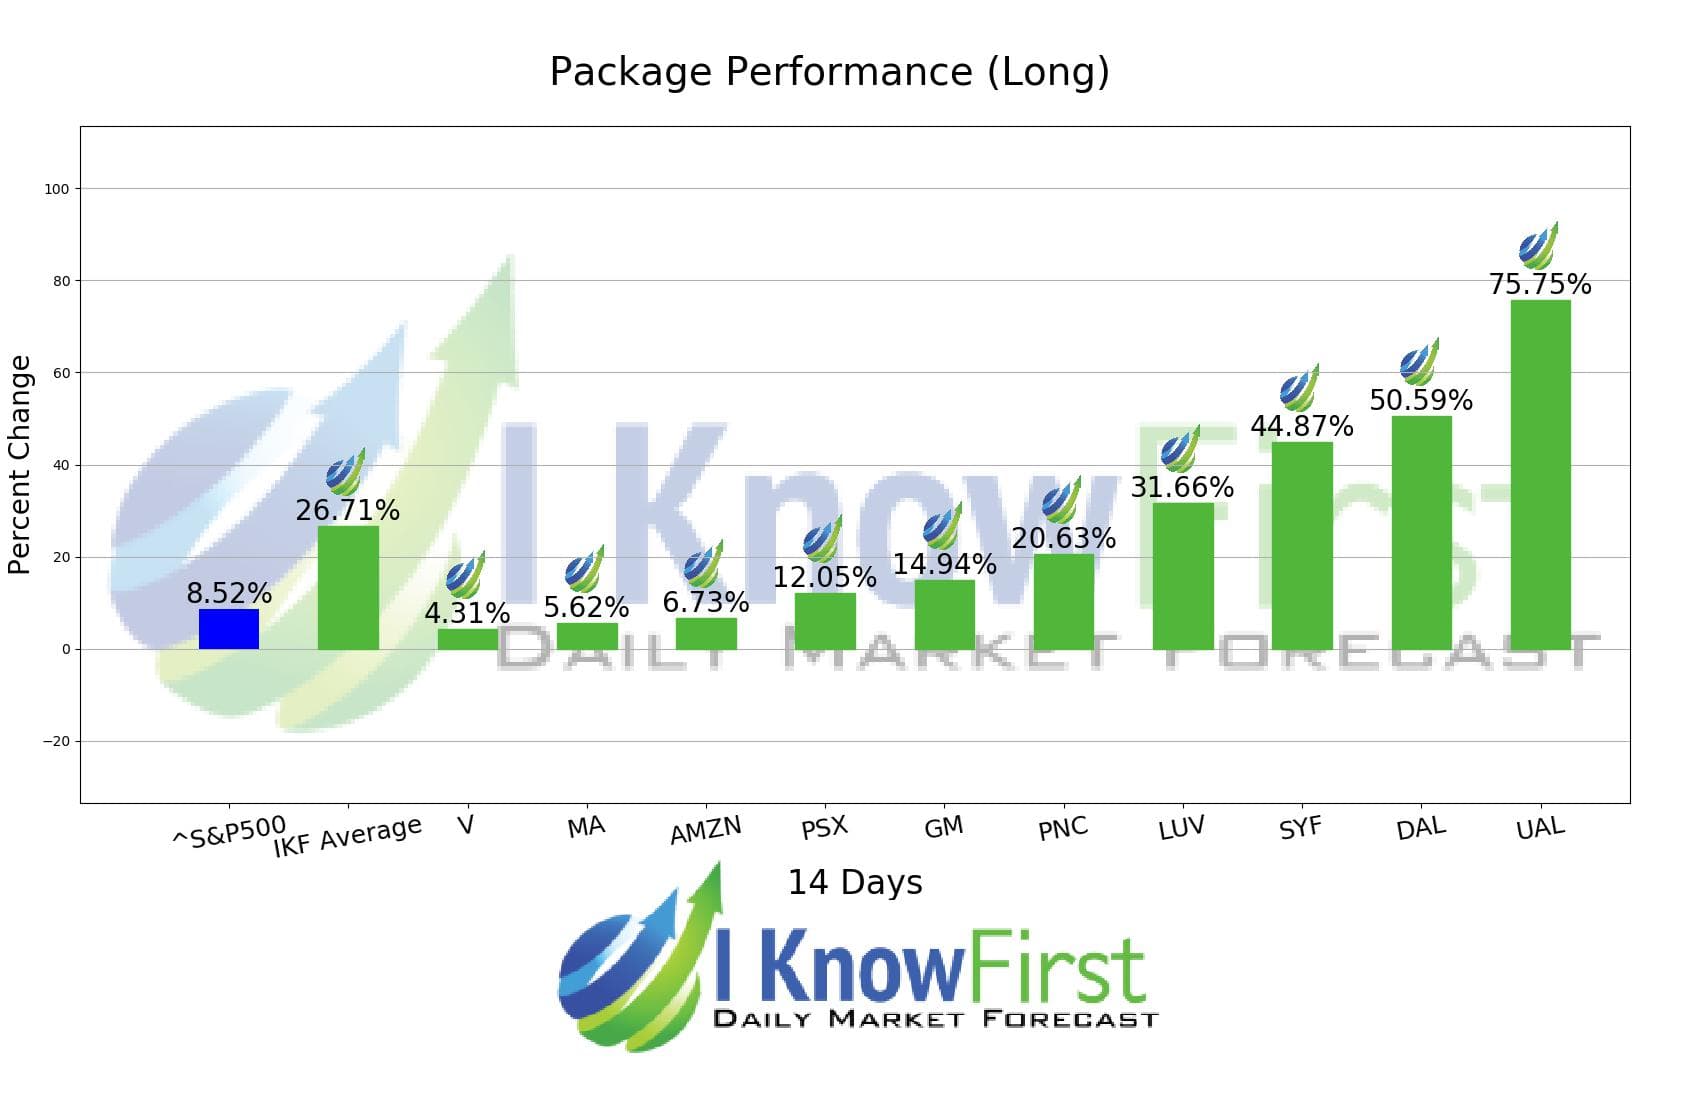
During the 14 Days forecasted period several picks in the Warren Buffett Portfolio Package saw significant returns. The algorithm had correctly predicted 10 out 10 returns. The greatest return came from UAL at 75.75%. DAL, and SYF had notable returns of 50.59% and 44.87%. The overall average return in this Warren Buffett Portfolio package was 26.71%, providing investors with a 18.19% premium over the S&P 500’s return of 8.52% during the same period.
United Continental Holdings, Inc. (UAL) is an airline holding company, of which its principal subsidiary is United Air Lines, Inc. (United). The Company transports personal, mail and property through its mainline operations. It has global air rights in North America, Asia-Pacific, Europe, Middle East, Africa and Latin America.
Algorithmic traders utilize these daily forecasts by the I Know First market prediction system as a tool to enhance portfolio performance, verify their own analysis and act on market opportunities faster. This forecast was sent to current I Know First subscribers.
How to interpret this diagram
Algorithmic Stock Forecast: The table on the left is a stock forecast produced by I Know First’s algorithm. Each day, subscribers receive forecasts for six different time horizons. Note that the top 10 stocks in the 1-month forecast may be different than those in the 1-year forecast. In the included table, only the relevant stocks have been included. The boxes are arranged according to their respective signal and predictability values (see below for detailed definitions). A green box represents a positive forecast, suggesting a long position, while a red represents a negative forecast, suggesting a short position.
Please note-for trading decisions use the most recent forecast. Get today’s forecast and Top stock picks.


