
Warren Buffett Stocks Based on Algo Trading: Returns up to 66.99% in 1 Year
Warren Buffett Stocks
This Warren Buffett Stocks Portfolio is part of the Buffett’s Top 10 Package, as one of I Know First’s quantitative investment solutions. Investors generally utilize the I Know First advanced self-learning algorithm to take advantage of Warren Buffett’s proven investing strategy. The full Top 10 Warren Buffett’s Stocks Package includes the best stocks identified by the algorithm that are currently in Warren Buffett’s portfolio:
- Top 10 Warren Buffett’s stocks for long position
- Top 10 Warren Buffett’s stocks for short position

Package Name: Warren Buffett Portfolio
Recommended Positions: Long
Forecast Length: 1 Year (11/15/20 – 11/16/21)
I Know First Average: 38.88%
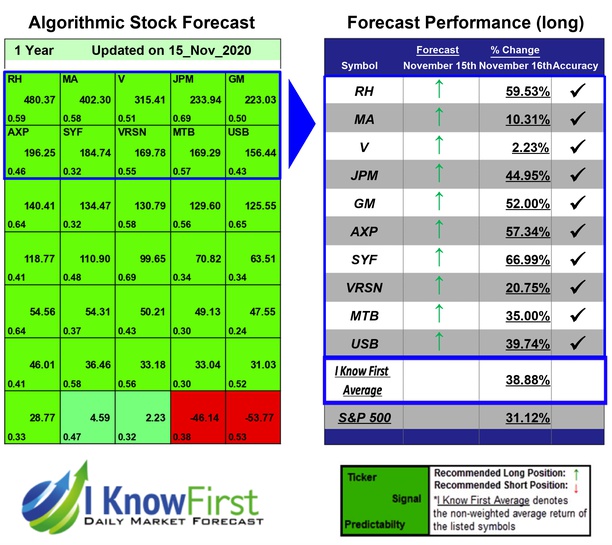
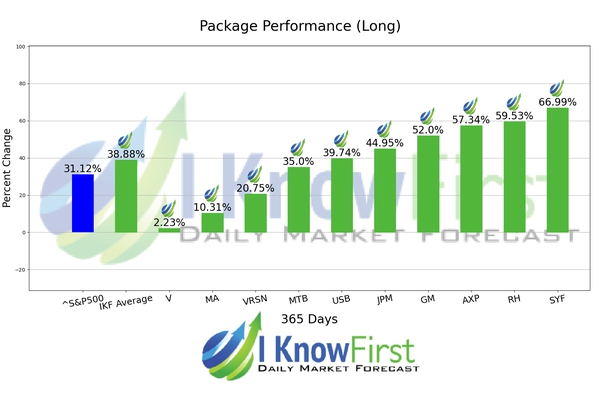
For this 1 Year forecast the algorithm had successfully predicted 10 out of 10 movements. SYF was our the best stock pick with a return of 66.99%. The suggested trades for RH and AXP also had notable 1 Year yields of 59.53% and 57.34%, respectively. The package had an overall average return of 38.88%, providing investors with a premium of 7.76% over the S&P 500’s return of 31.12% during the same period.
Algorithmic traders utilize these daily forecasts by the I Know First market prediction system as a tool to enhance portfolio performance, verify their own analysis and act on market opportunities faster. This forecast was sent to current I Know First subscribers.
How to interpret this diagram
Algorithmic Stock Forecast: The table on the left is a stock forecast produced by I Know First’s algorithm. Each day, subscribers receive forecasts for six different time horizons. Note that the top 10 stocks in the 1-month forecast may be different than those in the 1-year forecast. In the included table, only the relevant stocks have been included. The boxes are arranged according to their respective signal and predictability values (see below for detailed definitions). A green box represents a positive forecast, suggesting a long position, while a red represents a negative forecast, suggesting a short position.
Please note-for trading decisions use the most recent forecast. Get today’s forecast and Top stock picks.


